Winsor Hills is a Democratic stronghold. About 93% of voters here vote Democratic and 7% Republican.
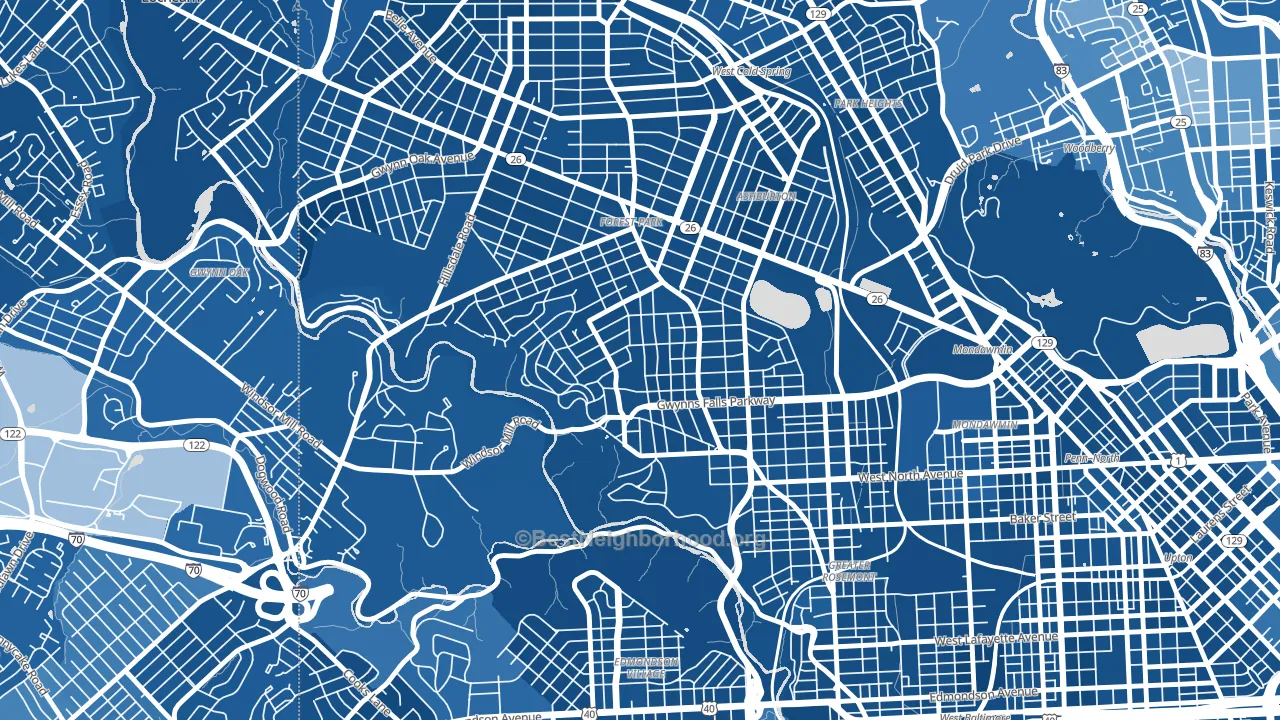
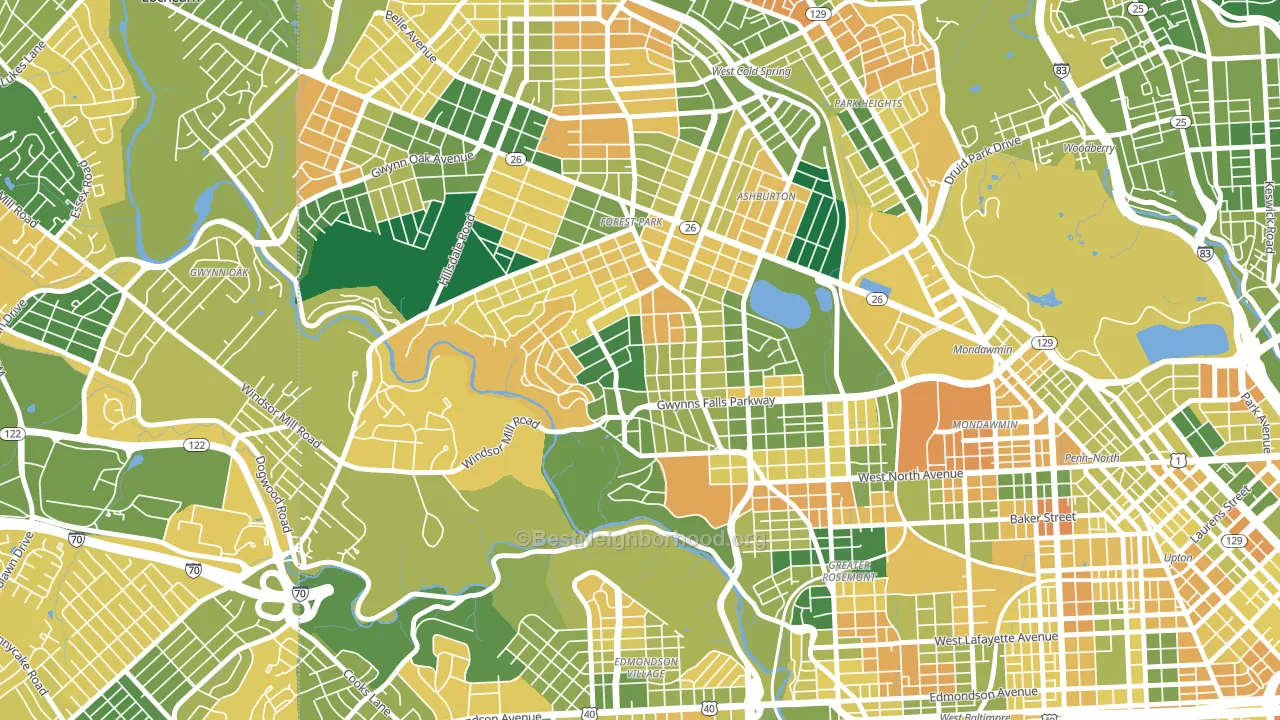
About 63% of adults in Winsor Hills typically vote, near the U.S. average of about 62%. Among adults in Winsor Hills, ~58% vote Democratic, ~5% Republican, and ~37% don't vote. The map below shows estimated turnout by block group.
How Winsor Hills compares
Among neighborhoods within 5 miles, Winsor Hills leans more Democratic than 39 of 40 neighbors.
Winsor Hills runs about 58 points more Democratic than Maryland as a whole.
Why Winsor Hills leans the way it does
This analysis examined 14,881 data points per neighborhood to find what predicts political lean and turnout. The items below are a few correlations that stood out for Winsor Hills, not a ranked or complete list of what matters most.
Areas with many never-married adults vote Democratic. About 47% of adults in Winsor Hills have never been married, about 18 points above the U.S. average of 29%.
Park access and Democratic lean
Places with heavy park coverage tend to lean Democratic; Winsor Hills, Baltimore, MD sits in the top quarter nationally on this measure. Park access does not change how people vote; it tends to track denser, higher-income areas.
Why turnout in Winsor Hills looks the way it does
Limited routine healthcare access lines up with lower turnout, and Winsor Hills sits in the bottom quarter on routine-care measures. Learn more about the findings and methodology on the political spectrum map.
Nearby Neighborhoods
- Forest Park, Baltimore, MD D+86
- Mondawin-Walbrook, Baltimore, MD D+86
- Howard Park, Gwynn Oak, MD D+85
- Hunting Ridge, Baltimore, MD D+86
- Park Heights, Baltimore, MD D+86
- Pimlico, Baltimore, MD D+85
- Beechfielf-Irvington Area, Baltimore, MD D+83
- Greater Rosemont, Baltimore, MD D+72
- Sandtown-Winchester, Baltimore, MD D+87
- Edmondson Heights, Woodlawn, MD D+81
Neighborhoods with Similar Populations
- Downtown Hilo, Hilo, HI D+33
- Forest Glen, Arlington, VA D+43
- East Harriet, Minneapolis, MN D+76
- Skunk City, Syracuse, NY D+46
- Forest Park Southeast, St. Louis, MO D+73
- Lovisa Farms, Pasco, WA R+23
- El Cerrito, Corona, CA R+18
- Lasalle College Park, Detroit, MI D+87
- International, San Bernardino, CA D+28
- Westhaven Trails, Madison, WI D+65
Sources and methodology
Precinct-level voting records used to fit the model come from Maryland State Board of Elections, distributed by the Voting and Election Science Team. Demographic inputs come from the U.S. Census Bureau (ACS 5-year estimates and the 2020 Decennial Census). Health and environmental inputs come from the CDC (PLACES and the Environmental Justice Index). Land cover comes from the USGS and EPA. Election-day and lead-up weather come from PRISM 4km daily grids and the NOAA Global Historical Climatology Network. Mail-voting and election-administration patterns come from the MIT Election Lab's Survey of the Performance of American Elections. Block-group crime detail comes from CrimeGrade. Internet data and modeling support provided by ISPreports.org.
Modeling and analysis by the BestNeighborhood data science team. Full methodology and findings: political spectrum map.
Methodology reviewed by the BestNeighborhood data team. Last updated May 2026.