Sandtown-Winchester is a Democratic stronghold. About 93% of voters here vote Democratic and 7% Republican.
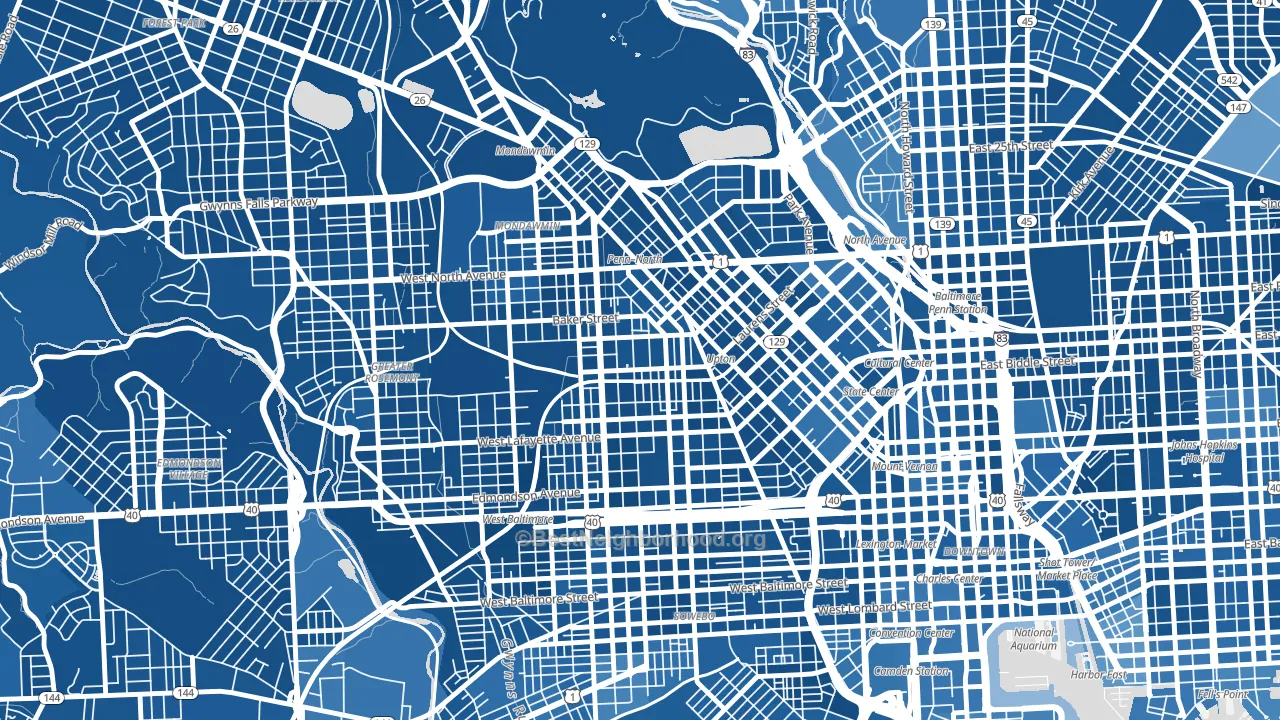
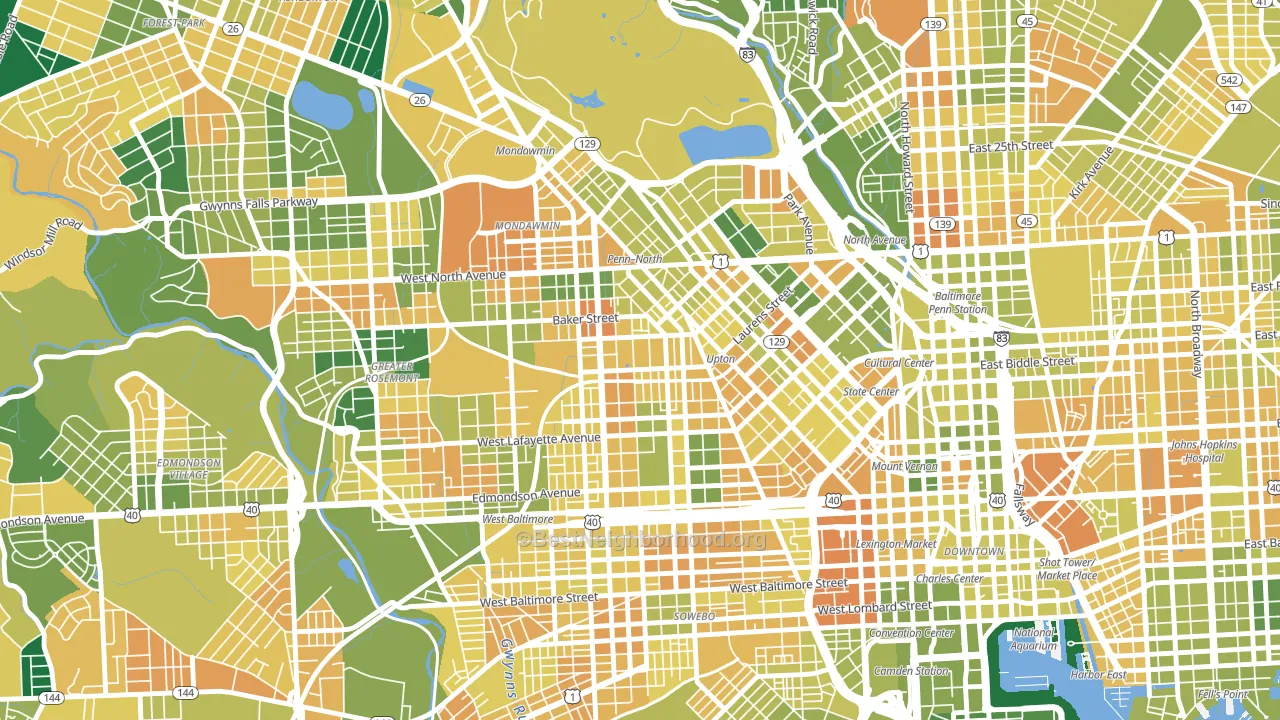
About 49% of adults in Sandtown-Winchester typically vote, below the U.S. average of about 62%. Among adults in Sandtown-Winchester, ~45% vote Democratic, ~4% Republican, and ~51% don't vote. The map below shows estimated turnout by block group.
How Sandtown-Winchester compares
Among neighborhoods within 5 miles, Sandtown-Winchester leans more Democratic than 45 of 49 neighbors.
Sandtown-Winchester runs about 58 points more Democratic than Maryland as a whole.
Why Sandtown-Winchester leans the way it does
This analysis examined 14,881 data points per neighborhood to find what predicts political lean and turnout. The items below are a few correlations that stood out for Sandtown-Winchester, not a ranked or complete list of what matters most.
Dense areas vote Democratic. More than 99% of residents in Sandtown-Winchester live in densely developed areas, about 64 points above the U.S. average of 36%. A high never-married share predicts Democratic voting, and about 65% of adults in Sandtown-Winchester have never been married, above 96% of neighborhoods.
Paved land cover and Democratic lean
Places with extensive paved surfaces tend to lean Democratic; Sandtown-Winchester, Baltimore, MD sits in the top tenth nationally on this measure. Paved ground does not change how people vote; it mostly reflects how urban and built-up a place is.
Why turnout in Sandtown-Winchester looks the way it does
Areas with high food insecurity turn out at lower rates. About 46% of adults in Sandtown-Winchester report food insecurity, about 29 points above the U.S. average of 16%. Low high-school completion lines up with lower turnout, and about 76% of adults in Sandtown-Winchester have completed high school, below 90% of neighborhoods. High-crime urban areas turn out at lower rates, and Sandtown-Winchester sits in the top 15% on a violent-crime measure. Learn more about the findings and methodology on the political spectrum map.
Nearby Neighborhoods
- West Baltimore, Baltimore, MD D+82
- Reservoir Hill-Bolton Hill, Baltimore, MD D+82
- Greater Rosemont, Baltimore, MD D+72
- Mondawin-Walbrook, Baltimore, MD D+86
- Mid-Town Belvedere, Baltimore, MD D+80
- Mount Vernon, Baltimore, MD D+80
- Downtown, Baltimore, MD D+75
- Washington Village, Baltimore, MD D+75
- Charles Village, Baltimore, MD D+79
- Oldtown, Baltimore, MD D+77
Neighborhoods with Similar Populations
- Laurelhurst, Seattle, WA D+70
- Marieville, Providence, RI D+12
- East Village Oxnard, Oxnard, CA D+24
- Kaisertown, Buffalo, NY D+6
- Russell Woods, Detroit, MI D+87
- Piqua Historic District, Piqua, OH R+38
- North Albany, Albany, OR D+15
- Southwest, San Antonio, TX D+21
- Outer Comstock, Syracuse, NY D+64
- Cazenovia Park, Buffalo, NY D+12
Sources and methodology
Precinct-level voting records used to fit the model come from Maryland State Board of Elections, distributed by the Voting and Election Science Team. Demographic inputs come from the U.S. Census Bureau (ACS 5-year estimates and the 2020 Decennial Census). Health and environmental inputs come from the CDC (PLACES and the Environmental Justice Index). Land cover comes from the USGS and EPA. Election-day and lead-up weather come from PRISM 4km daily grids and the NOAA Global Historical Climatology Network. Mail-voting and election-administration patterns come from the MIT Election Lab's Survey of the Performance of American Elections. Block-group crime detail comes from CrimeGrade. Internet data and modeling support provided by ISPreports.org.
Modeling and analysis by the BestNeighborhood data science team. Full methodology and findings: political spectrum map.
Methodology reviewed by the BestNeighborhood data team. Last updated May 2026.