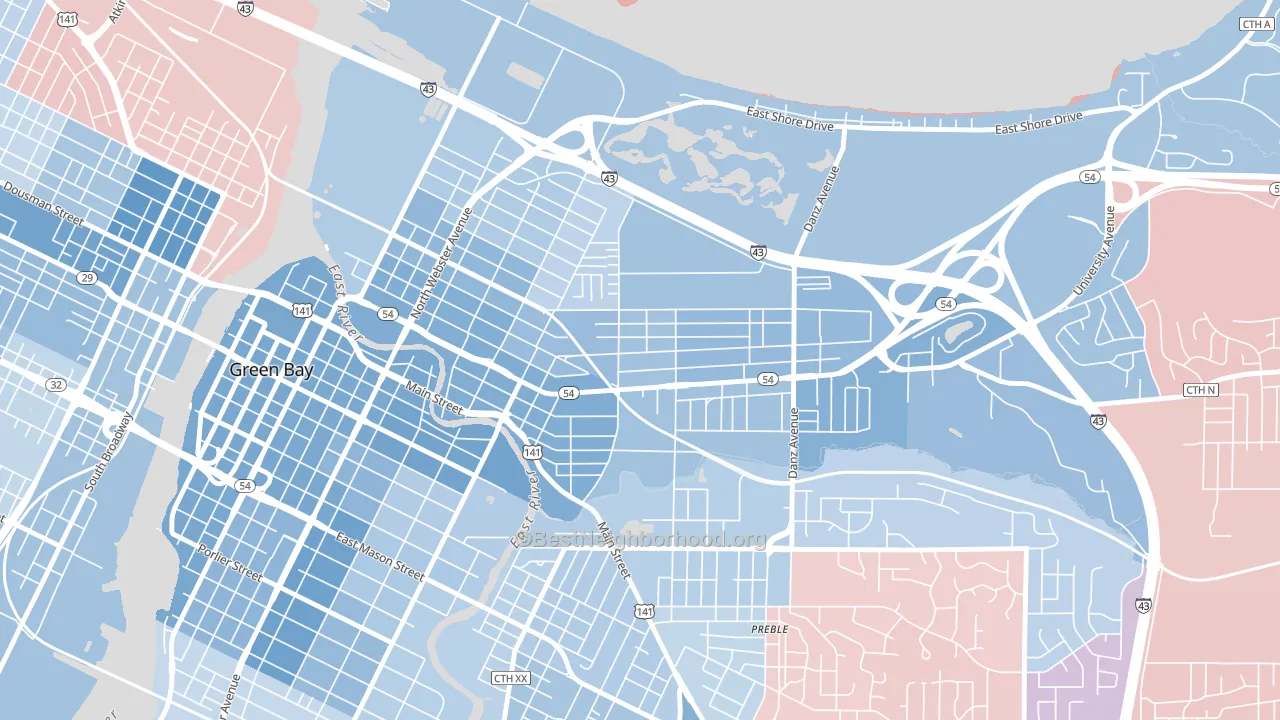
Haevers Corners leans Democratic by roughly 20 points: about 60% of voters vote Democratic and 40% Republican.
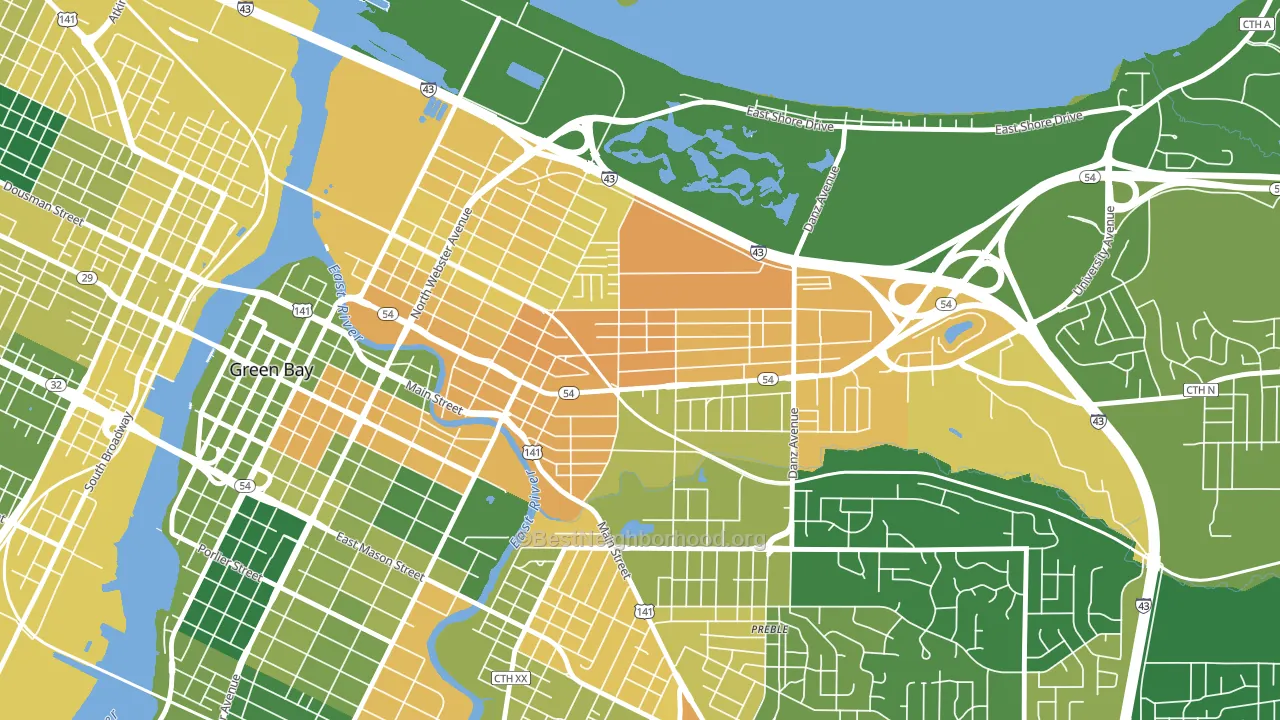
About 45% of adults in Haevers Corners typically vote, below the U.S. average of about 62%. Among adults in Haevers Corners, ~27% vote Democratic, ~18% Republican, and ~55% don't vote. The map below shows estimated turnout by block group.
How Haevers Corners compares
Haevers Corners sits in a sparsely populated area with few comparable neighborhoods nearby.
Haevers Corners runs about 20 points more Democratic than Wisconsin as a whole. Wisconsin is roughly evenly split, and Haevers Corners sits clearly on the Democratic side.
Politics vary noticeably by block within Haevers Corners. The southwest side is the most Democratic-leaning (D+30) and the north side is the least Democratic-leaning (D+13), a spread of about 17 points.
Why Haevers Corners leans the way it does
This analysis examined 14,881 data points per neighborhood to find what predicts political lean and turnout. The items below are a few correlations that stood out for Haevers Corners, not a ranked or complete list of what matters most.
Density combined with diversity predicts Democratic voting. Non-Hispanic white share in Haevers Corners is about 41%, about 31 points below the U.S. average of 72%. Haevers Corners runs against the grain of Wisconsin, a Democratic-leaning outlier in a roughly evenly split state.
Park access and Democratic lean
Places with heavy park coverage tend to lean Democratic; Haevers Corners, Green Bay, WI sits in the top quarter nationally on this measure. Park access does not change how people vote; it tends to track denser, higher-income areas.
Why turnout in Haevers Corners looks the way it does
Areas with limited routine healthcare access turn out at lower rates. Haevers Corners is in the bottom quarter nationally for routine-care measures such as insurance coverage, preventive screenings, and dental visits. The uninsured rate here is about 21%, about 13 points above the Wisconsin average of 8%. High food insecurity lines up with lower turnout, and about 29% of adults in Haevers Corners report food insecurity, above 82% of neighborhoods. Low high-school completion lines up with lower turnout, and about 73% of adults in Haevers Corners have completed high school, below 93% of neighborhoods. Learn more about the findings and methodology on the political spectrum map.
Nearby Neighborhoods
- Fort Howard, Green Bay, WI D+12
- Western Corridor, Green Bay, WI D+15
- Downtown Appleton, Appleton, WI D+21
- Menominee South, Oshkosh, WI D+17
- South Pier, Sheboygan, WI D+12
- SW Jones, Wausau, WI Even
- Westies, Wausau, WI D+11
- Village Centre, Menomonee Falls, WI R+4
- Bradley Estates, Milwaukee, WI D+66
- Town and Country Manor, Milwaukee, WI D+74
Neighborhoods with Similar Populations
- Turner-Meyn Park, Hammond, IN D+19
- Eagledale, Indianapolis, IN D+35
- North Lincoln Street, Worcester, MA D+38
- South India Mound, Kansas City, MO D+39
- Fairpark, Salt Lake City, UT D+40
- Gresham-Northwest, Gresham, OR D+24
- Highlands, Beaverton, OR D+38
- Clayton, Kansas City, MO D+9
- Wallace Woods, Covington, KY D+13
- Kamala Park, Oxnard, CA D+37
Sources and methodology
Precinct-level voting records used to fit the model come from Wisconsin Elections Commission, distributed by the Voting and Election Science Team. Demographic inputs come from the U.S. Census Bureau (ACS 5-year estimates and the 2020 Decennial Census). Health and environmental inputs come from the CDC (PLACES and the Environmental Justice Index). Land cover comes from the USGS and EPA. Election-day and lead-up weather come from PRISM 4km daily grids and the NOAA Global Historical Climatology Network. Mail-voting and election-administration patterns come from the MIT Election Lab's Survey of the Performance of American Elections. Block-group crime detail comes from CrimeGrade. Internet data and modeling support provided by ISPreports.org.
Modeling and analysis by the BestNeighborhood data science team. Full methodology and findings: political spectrum map.
Methodology reviewed by the BestNeighborhood data team. Last updated May 2026.