Hendricks is a Republican stronghold. About 11% of voters here vote Democratic and 89% Republican.
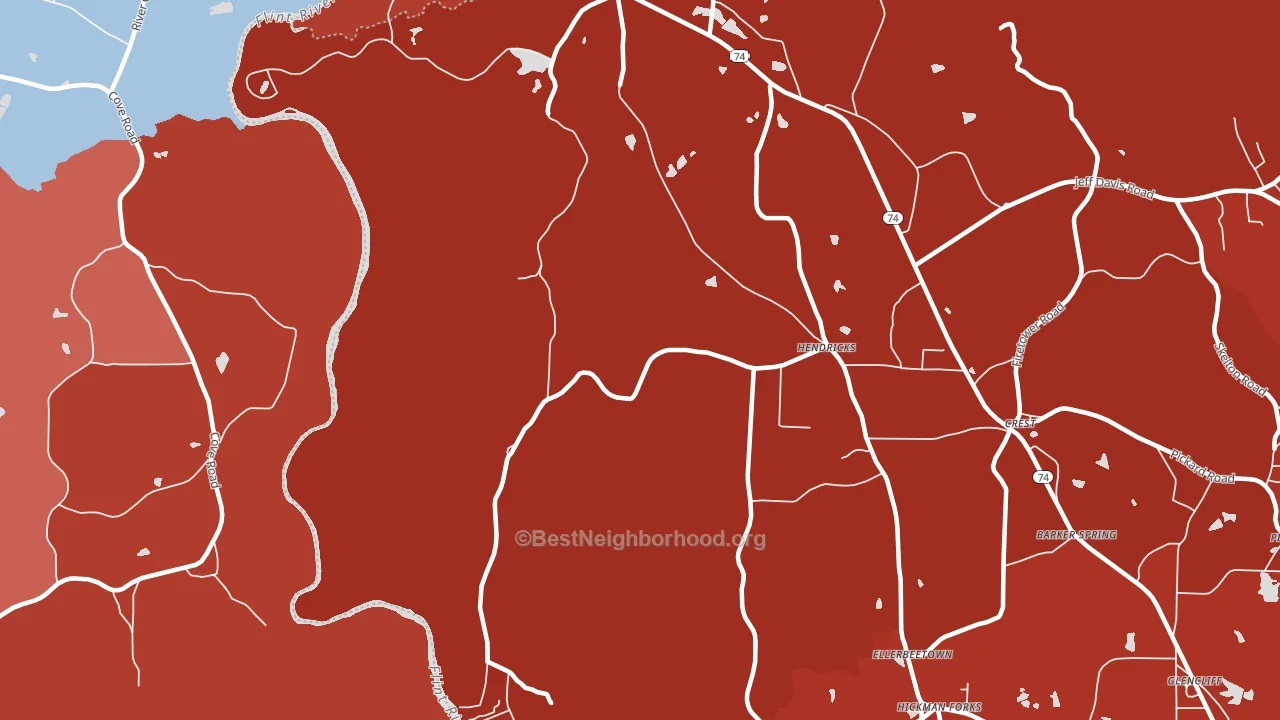
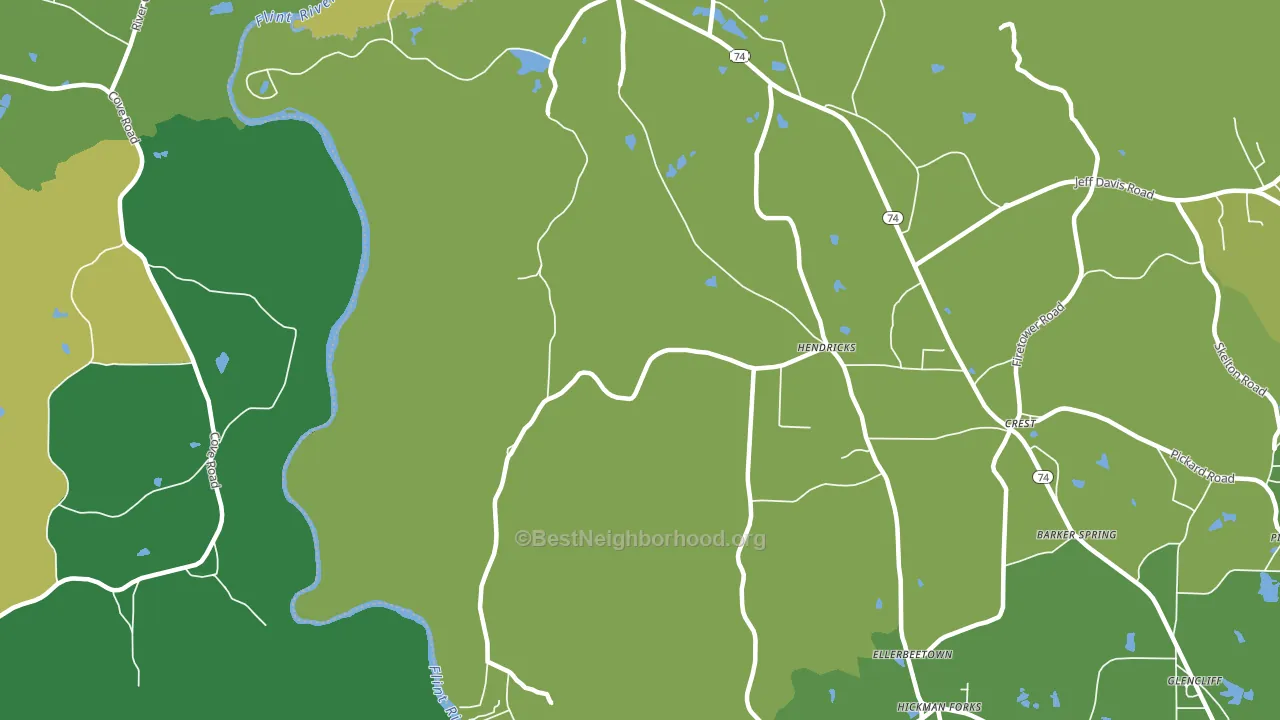
About 72% of adults in Hendricks typically vote, above the U.S. average of about 62%. Among adults in Hendricks, ~8% vote Democratic, ~64% Republican, and ~28% don't vote. The map below shows estimated turnout by block group.
How Hendricks compares
Among cities within 25 miles, Hendricks is the most Republican-leaning.
Hendricks runs about 76 points more Republican than Georgia as a whole.
Why Hendricks leans the way it does
This analysis examined 14,881 data points per city to find what predicts political lean and turnout. The items below are a few correlations that stood out for Hendricks, not a ranked or complete list of what matters most.
Areas with a high white share and below-average college attainment vote Republican. In Hendricks, about 97% of residents are non-Hispanic white, about 24 points above the U.S. average of 72%; about 13% of adults hold a bachelor's degree, about 11 points below the Georgia average of 24%. Car-dependent areas vote Republican, and about 88% of residents in Hendricks drive to work alone, above 90% of cities.
Homeownership and voter turnout
Places with homeowner-heavy households tend to turn out at a higher rate; Hendricks, GA sits in the top quarter nationally on this measure.
Why turnout in Hendricks looks the way it does
Homeowners vote more often than renters. About 91% of households in Hendricks own their home, about 18 points above the Georgia average of 73%. Learn more about the findings and methodology on the political spectrum map.
Nearby Cities
- Molena, GA R+74
- Glencliff, GA R+76
- Sunset Village, GA R+76
- Woodbury, GA R+14
- Chalybeate Springs, GA R+34
- Neal, GA R+62
- Thomaston, GA R+25
- Raleigh, GA R+38
Cities with Similar Populations
- State Line, AR R+60
- Center, OK R+70
- Carterton, VA R+69
- Sardis, SC R+27
- Mouth of Laurel, VA R+73
- Rimer, OH R+72
- Fairfield, WI R+36
- Naftel, AL R+53
- Tomales, CA D+35
- Harding, GA R+78
Sources and methodology
Precinct-level voting records used to fit the model come from Georgia Elections Division, distributed by the Voting and Election Science Team. Demographic inputs come from the U.S. Census Bureau (ACS 5-year estimates and the 2020 Decennial Census). Health and environmental inputs come from the CDC (PLACES and the Environmental Justice Index). Land cover comes from the USGS and EPA. Election-day and lead-up weather come from PRISM 4km daily grids and the NOAA Global Historical Climatology Network. Mail-voting and election-administration patterns come from the MIT Election Lab's Survey of the Performance of American Elections. Block-group crime detail comes from CrimeGrade. Internet data and modeling support provided by ISPreports.org.
Modeling and analysis by the BestNeighborhood data science team. Full methodology and findings: political spectrum map.
Methodology reviewed by the BestNeighborhood data team. Last updated May 2026.