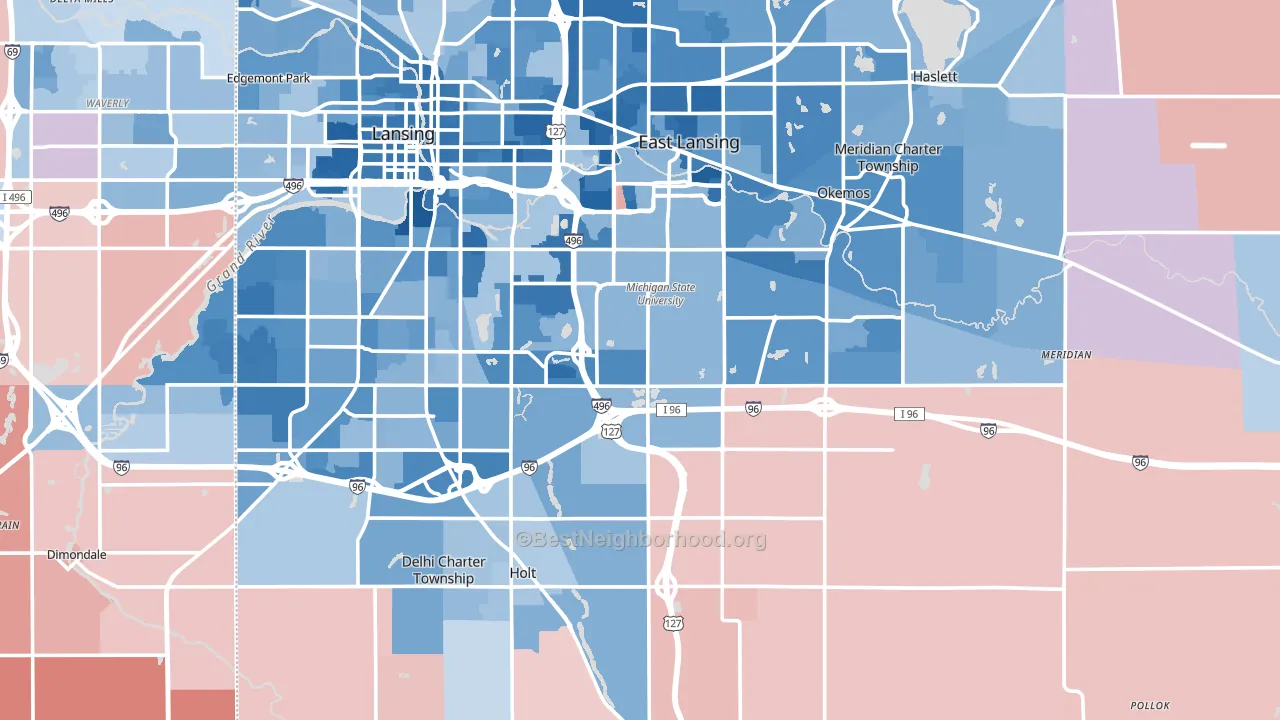
Ingham County leans heavily Democratic by roughly 32 points: about 66% of voters vote Democratic and 34% Republican.
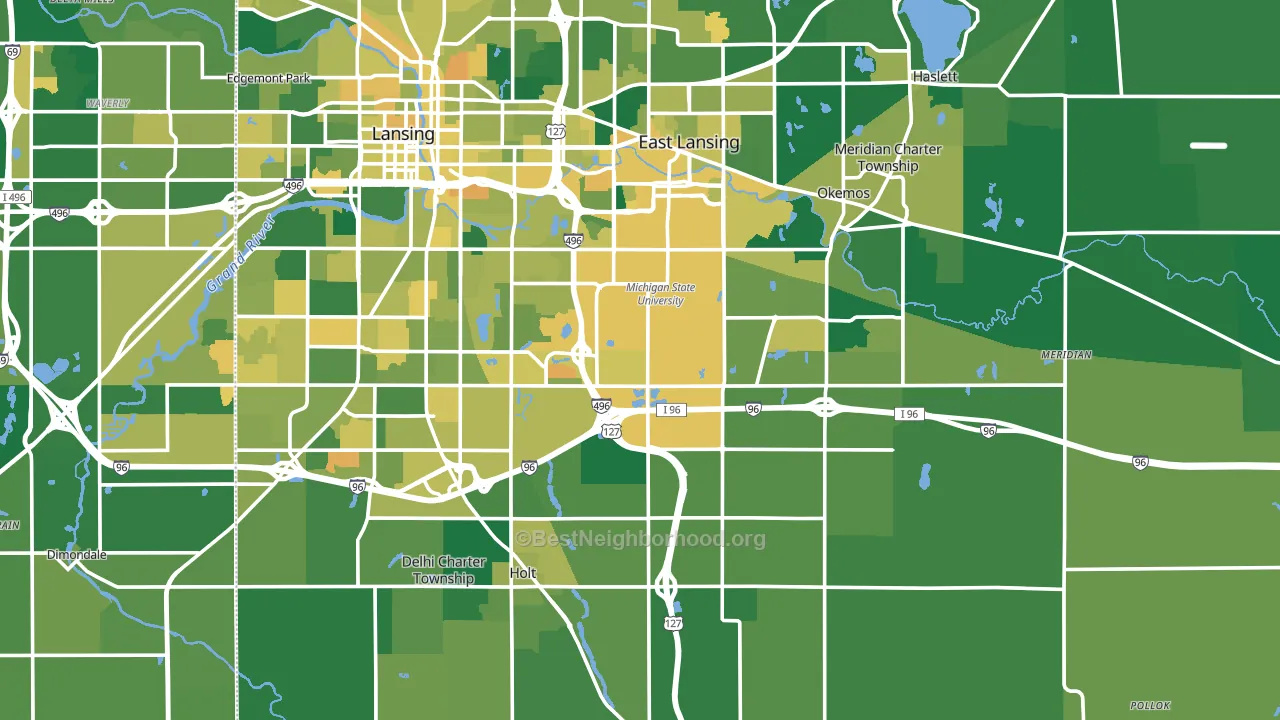
About 77% of adults in Ingham County typically vote, above the U.S. average of about 62%. Among adults in Ingham County, ~51% vote Democratic, ~26% Republican, and ~23% don't vote. The map below shows estimated turnout by block group.
How Ingham County compares
Among counties within 50 miles, Ingham County leans more Democratic than 10 of 11 neighbors.
Ingham County runs about 33 points more Democratic than Michigan as a whole. Michigan is roughly evenly split, and Ingham County sits clearly on the Democratic side.
Politics vary noticeably by city within Ingham County. The north side runs the most Democratic (D+53) and the southeast side runs the most Republican (R+22), a spread of about 75 points.
Why Ingham County leans the way it does
This analysis examined 14,881 data points per county to find what predicts political lean and turnout. The items below are a few correlations that stood out for Ingham County, not a ranked or complete list of what matters most.
Dense areas vote Democratic. About 75% of residents in Ingham County live in densely developed areas, about 39 points above the U.S. average of 36%. High college attainment predicts Democratic voting, and Ingham County sits in the top quarter (about 43%, above 94% of counties). A high never-married share predicts Democratic voting, and about 43% of adults in Ingham County have never been married, above 96% of counties.
Population density and Democratic lean
Places with high population density tend to lean Democratic; Ingham County, MI sits in the top tenth nationally on this measure.
Why turnout in Ingham County looks the way it does
Areas with strong routine healthcare access turn out at higher rates. Ingham County is in the top quarter nationally for routine-care measures such as insurance coverage, preventive screenings, and dental visits. The dental-visit rate here is about 68%, about 8 points above the U.S. average of 60%. High high-school completion lines up with higher turnout, and about 94% of adults in Ingham County have completed high school, above 84% of counties. Learn more about the findings and methodology on the political spectrum map.
Nearby Counties
- Eaton County, MI R+8
- Clinton County, MI R+12
- Shiawassee County, MI R+27
- Jackson County, MI R+14
- Livingston County, MI R+23
- Ionia County, MI R+30
- Calhoun County, MI R+9
- Barry County, MI R+34
- Genesee County, MI D+8
- Gratiot County, MI R+28
Counties with Similar Populations
- Winnebago County, IL D+7
- Benton County, AR R+26
- Dauphin County, PA D+12
- San Luis Obispo County, CA D+8
- York County, SC R+17
- Merced County, CA R+3
- Anchorage Municipality, AK D+20
- Alachua County, FL D+22
- Leon County, FL D+26
- Lexington County, SC R+30
Sources and methodology
Precinct-level voting records used to fit the model come from Michigan Department of State, Elections, distributed by the Voting and Election Science Team. Demographic inputs come from the U.S. Census Bureau (ACS 5-year estimates and the 2020 Decennial Census). Health and environmental inputs come from the CDC (PLACES and the Environmental Justice Index). Land cover comes from the USGS and EPA. Election-day and lead-up weather come from PRISM 4km daily grids and the NOAA Global Historical Climatology Network. Mail-voting and election-administration patterns come from the MIT Election Lab's Survey of the Performance of American Elections. Block-group crime detail comes from CrimeGrade. Internet data and modeling support provided by ISPreports.org.
Modeling and analysis by the BestNeighborhood data science team. Full methodology and findings: political spectrum map.
Methodology reviewed by the BestNeighborhood data team. Last updated May 2026.