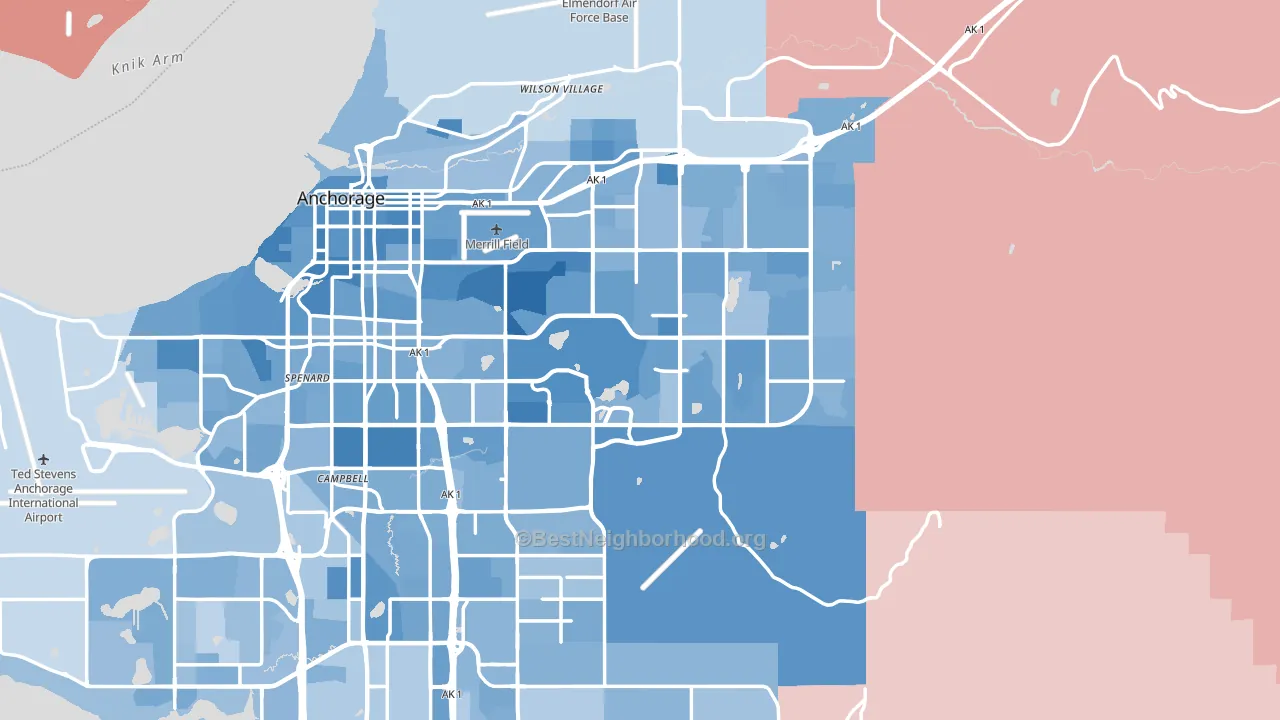
Anchorage Municipality leans Democratic by roughly 20 points: about 60% of voters vote Democratic and 40% Republican. These figures are model estimates: Alaska did not have precinct-level voting records available for training, so the numbers above come from demographic and health features rather than local ground truth.
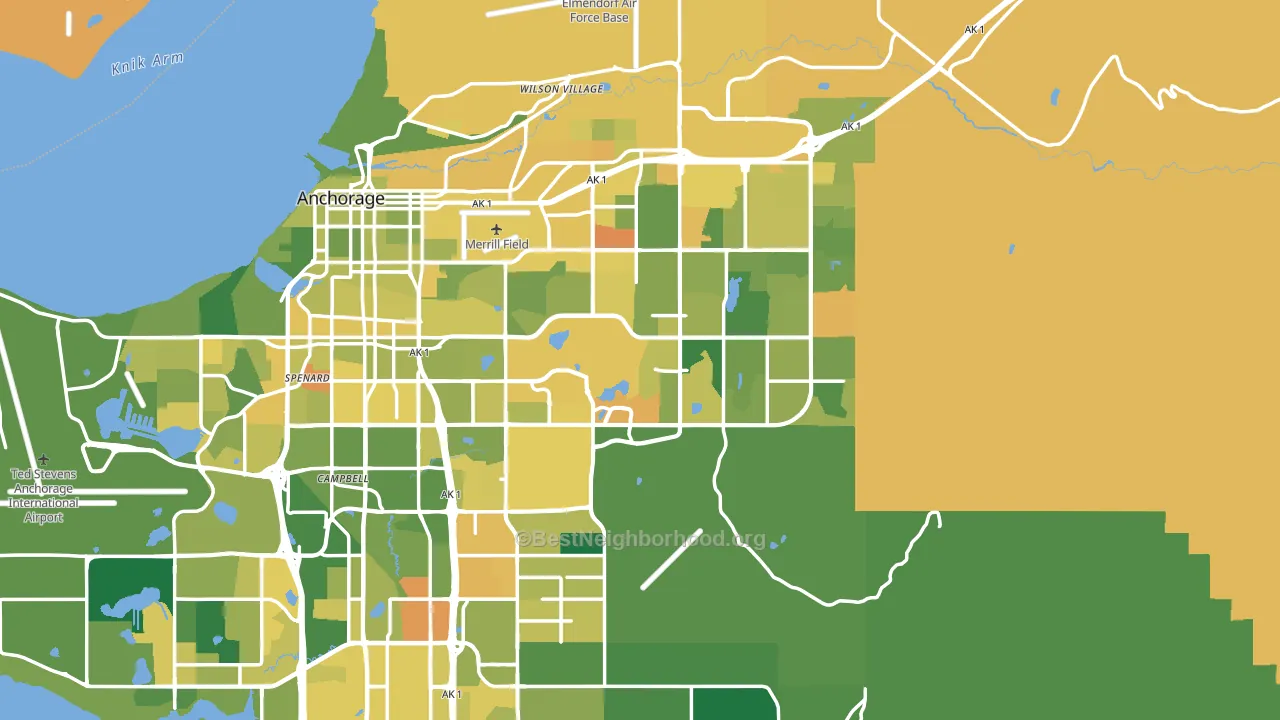
About 62% of adults in Anchorage Municipality typically vote, near the U.S. average of about 62%. Among adults in Anchorage Municipality, ~37% vote Democratic, ~25% Republican, and ~38% don't vote. The map below shows estimated turnout by block group.
How Anchorage Municipality compares
Anchorage Municipality runs about 33 points more Democratic than Alaska as a whole. Alaska leans Republican overall, while Anchorage Municipality is one of the few Democratic-leaning pockets.
Politics vary noticeably by city within Anchorage Municipality. The northwest side is the most Democratic-leaning (D+37) and the northeast side is the least Democratic-leaning (D+6), a spread of about 31 points.
Why Anchorage Municipality leans the way it does
This analysis examined 14,881 data points per county to find what predicts political lean and turnout. The items below are a few correlations that stood out for Anchorage Municipality, not a ranked or complete list of what matters most.
Areas with high college attainment vote Democratic. About 38% of adults in Anchorage Municipality hold a bachelor's degree, about 10 points above the U.S. average of 28%. A high never-married share predicts Democratic voting, and about 35% of adults in Anchorage Municipality have never been married, above 84% of counties. Anchorage Municipality runs against the grain of Alaska, a Democratic-leaning pocket in a Republican-leaning state.
Local retail density and voter turnout
Places with dense local retail within a mile tend to turn out at a higher rate; Anchorage Municipality, AK sits in the top tenth nationally on this measure. Nearby retail does not change how people vote; it reflects how urban and built-up a place is.
Why turnout in Anchorage Municipality looks the way it does
Areas with high high-school completion turn out at higher rates. About 94% of adults in Anchorage Municipality have completed high school, above 84% of counties. Learn more about the findings and methodology on the political spectrum map.
Nearby Counties
- Matanuska-Susitna Borough, AK R+33
- Kenai Peninsula Borough, AK R+27
- Denali Borough, AK R+37
- Southeast Fairbanks Census Area, AK R+39
- Kodiak Island Borough, AK R+16
- Fairbanks North Star Borough, AK R+9
- Yukon-Koyukuk Census Area, AK D+17
- Lake and Peninsula Borough, AK D+13
- Bristol Bay Borough, AK Even
- Dillingham Census Area, AK D+19
Counties with Similar Populations
- Leon County, FL D+26
- Lexington County, SC R+30
- Thurston County, WA D+19
- Chatham County, GA D+26
- Cleveland County, OK R+14
- Dutchess County, NY D+8
- Dauphin County, PA D+12
- Ottawa County, MI R+16
- Winnebago County, IL D+7
- Ingham County, MI D+31
Sources and methodology
Precinct-level voting records used to fit the model come from Alaska Division of Elections, distributed by the Voting and Election Science Team. Demographic inputs come from the U.S. Census Bureau (ACS 5-year estimates and the 2020 Decennial Census). Health and environmental inputs come from the CDC (PLACES and the Environmental Justice Index). Land cover comes from the USGS and EPA. Election-day and lead-up weather come from PRISM 4km daily grids and the NOAA Global Historical Climatology Network. Mail-voting and election-administration patterns come from the MIT Election Lab's Survey of the Performance of American Elections. Block-group crime detail comes from CrimeGrade. Internet data and modeling support provided by ISPreports.org.
Modeling and analysis by the BestNeighborhood data science team. AK did not have precinct-level voting records available for training, so the figures here come from extrapolation across demographic, health, and land-use features rather than local ground truth. Full methodology and findings: political spectrum map.
Methodology reviewed by the BestNeighborhood data team. Last updated May 2026.