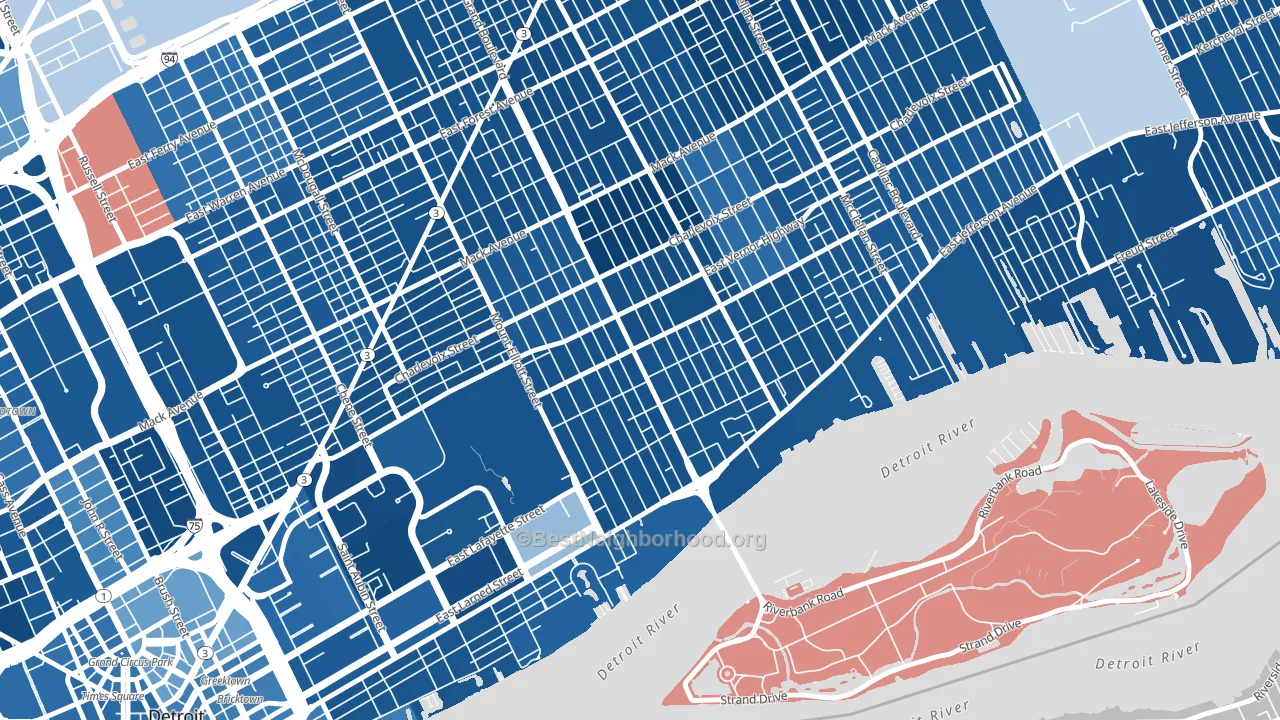
Islandview is a Democratic stronghold. About 91% of voters here vote Democratic and 9% Republican.
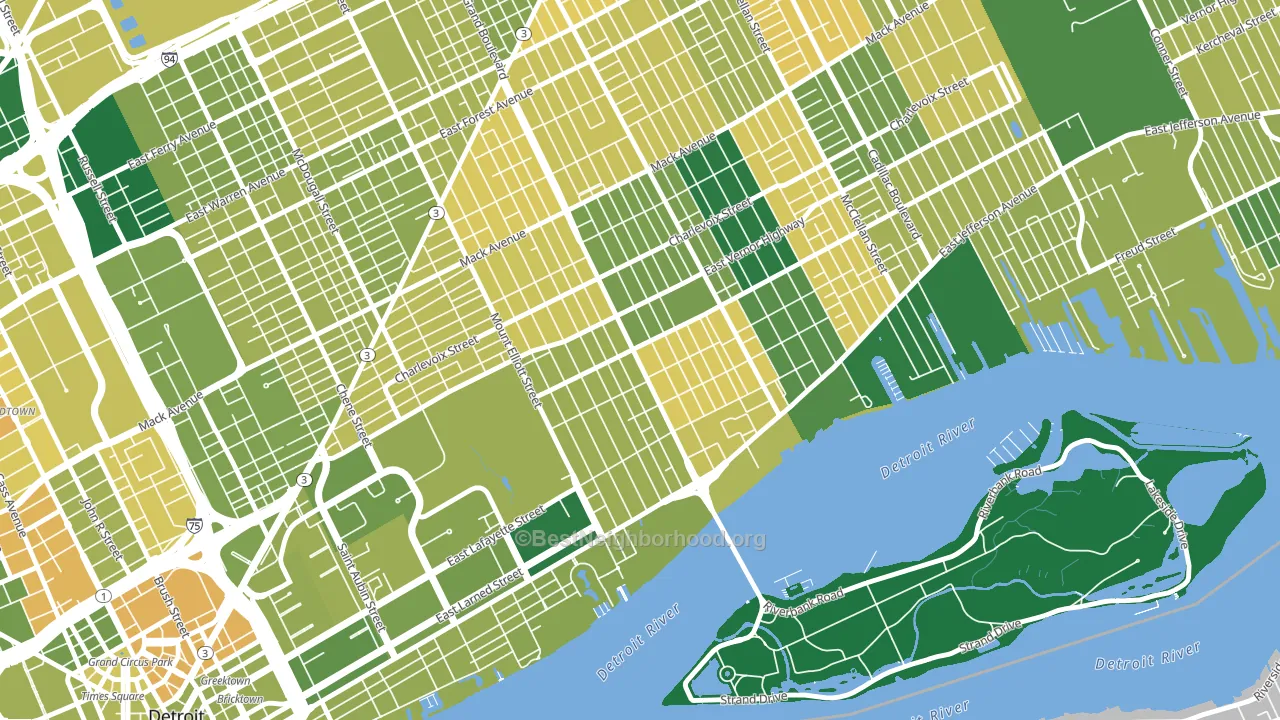
About 59% of adults in Islandview typically vote, near the U.S. average of about 62%. Among adults in Islandview, ~54% vote Democratic, ~5% Republican, and ~41% don't vote. The map below shows estimated turnout by block group.
How Islandview compares
Among neighborhoods within 5 miles, Islandview leans more Democratic than 12 of 22 neighbors.
Islandview runs about 83 points more Democratic than Michigan as a whole. Michigan is roughly evenly split, and Islandview sits clearly on the Democratic side.
Why Islandview leans the way it does
This analysis examined 14,881 data points per neighborhood to find what predicts political lean and turnout. The items below are a few correlations that stood out for Islandview, not a ranked or complete list of what matters most.
Dense areas vote Democratic. More than 99% of residents in Islandview live in densely developed areas, about 64 points above the U.S. average of 36%. A high never-married share predicts Democratic voting, and about 61% of adults in Islandview have never been married, above 94% of neighborhoods. Islandview runs against the grain of Michigan, a Democratic-leaning outlier in a roughly evenly split state.
Preventive-care access and voter turnout
Places with limited routine preventive-care access tend to turn out at a lower rate; Islandview, Detroit, MI sits in the bottom quarter nationally on this measure. Dental visits do not drive turnout; the rate reflects income, insurance, and healthcare access, which line up with who votes.
Why turnout in Islandview looks the way it does
Areas with high food insecurity turn out at lower rates. About 37% of adults in Islandview report food insecurity, about 21 points above the U.S. average of 16%. High-crime urban areas turn out at lower rates, and Islandview sits in the top 15% on a violent-crime measure. Learn more about the findings and methodology on the political spectrum map.
Nearby Neighborhoods
- Elmwood Park, Detroit, MI D+88
- Kettering-Butzel, Detroit, MI D+87
- Lafayette Park, Detroit, MI D+75
- St Jean, Detroit, MI D+87
- Downtown Detroit, Detroit, MI D+62
- Midtown-Detroit, Detroit, MI D+73
- Chene, Detroit, MI D+23
- Jefferson Chalmers, Detroit, MI D+84
- Wayne State, Detroit, MI D+66
- Airport, Detroit, MI D+57
Neighborhoods with Similar Populations
- Northwestern Denver, Denver, CO D+48
- Cuesta Park, Mountain View, CA D+40
- Chestnut Park, Trenton, NJ D+42
- Springdale, York, PA D+42
- Whittier, Denver, CO D+79
- Falcon Landing, Katy, TX R+10
- North Garrett Road, Durham, NC D+58
- Castlegate, San Tan Valley, AZ R+32
- Little Flower, Indianapolis, IN D+46
- Avondale, Sacramento, CA D+28
Sources and methodology
Precinct-level voting records used to fit the model come from Michigan Department of State, Elections, distributed by the Voting and Election Science Team. Demographic inputs come from the U.S. Census Bureau (ACS 5-year estimates and the 2020 Decennial Census). Health and environmental inputs come from the CDC (PLACES and the Environmental Justice Index). Land cover comes from the USGS and EPA. Election-day and lead-up weather come from PRISM 4km daily grids and the NOAA Global Historical Climatology Network. Mail-voting and election-administration patterns come from the MIT Election Lab's Survey of the Performance of American Elections. Block-group crime detail comes from CrimeGrade. Internet data and modeling support provided by ISPreports.org.
Modeling and analysis by the BestNeighborhood data science team. Full methodology and findings: political spectrum map.
Methodology reviewed by the BestNeighborhood data team. Last updated May 2026.