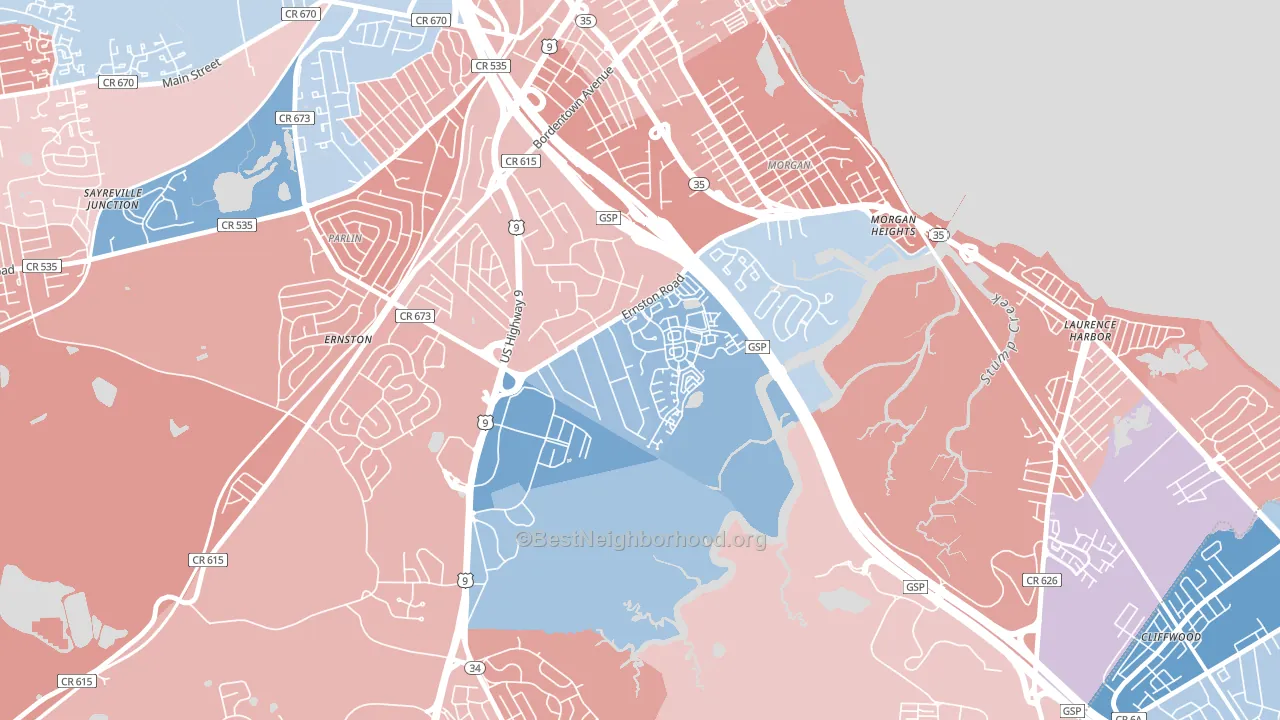
La Mer leans Democratic by roughly 16 points: about 58% of voters vote Democratic and 42% Republican.
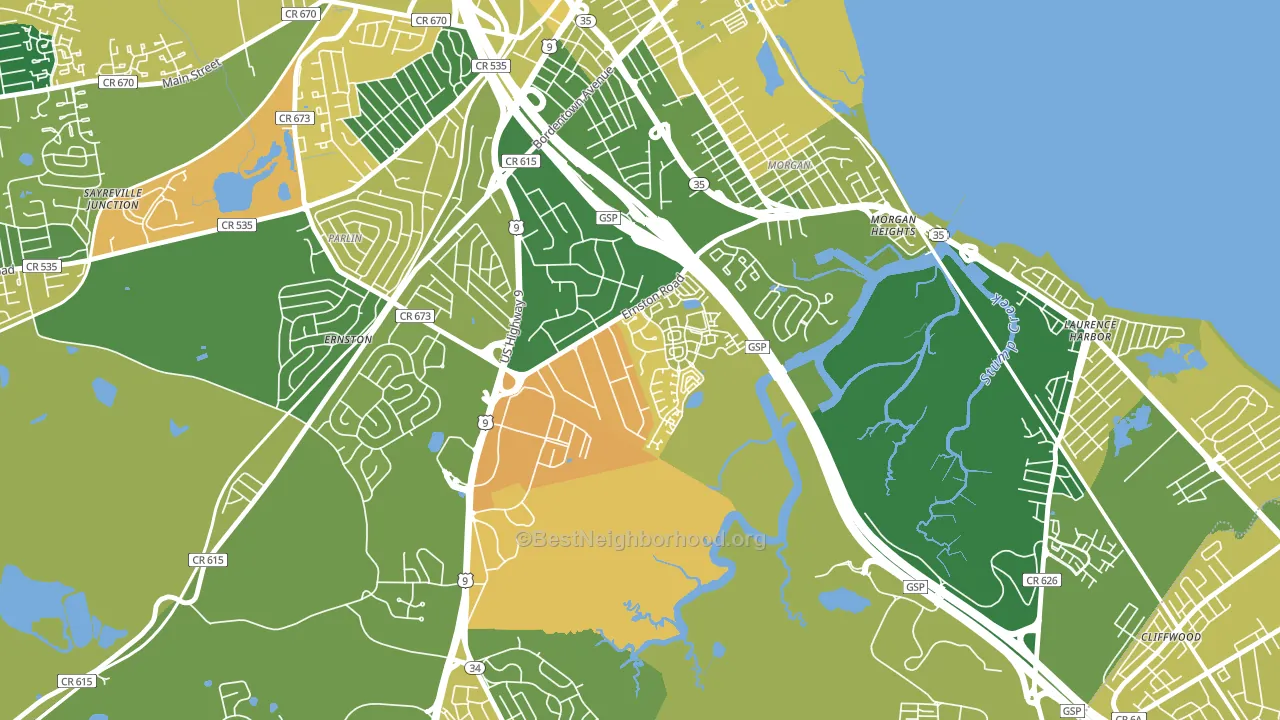
About 54% of adults in La Mer typically vote, below the U.S. average of about 62%. Among adults in La Mer, ~31% vote Democratic, ~23% Republican, and ~46% don't vote. The map below shows estimated turnout by block group.
How La Mer compares
Among neighborhoods within 5 miles, La Mer is the most Democratic-leaning.
La Mer runs about 9 points more Democratic than New Jersey as a whole.
Politics vary noticeably by block within La Mer. The south side runs the most Democratic (D+21) and the northwest side runs the most Republican (R+11), a spread of about 32 points.
Why La Mer leans the way it does
Density, race composition, education, and family structure all sit close to their national averages in La Mer. The lean here lands roughly where demographic data alone would predict.
Homeownership and voter turnout
Places with renter-heavy households tend to turn out at a lower rate; La Mer, Parlin, NJ sits in the bottom quarter nationally on this measure.
Why turnout in La Mer looks the way it does
Crowded housing lines up with lower turnout. About 7% of homes in La Mer have more than one occupant per room, above 84% of neighborhoods. Learn more about the findings and methodology on the political spectrum map.
Nearby Neighborhoods
- Presidents Park, Parlin, NJ R+10
- Townelake, Sayreville, NJ R+11
- Ravine Gardens, Matawan, NJ R+4
- Tottenville, Staten Island, NY R+62
- Creighton Village, Old Bridge, NJ R+24
- Southwood, Old Bridge, NJ R+22
- Bonhamtown, Edison, NJ D+16
- Charleston, Staten Island, NY R+51
- Prince's Bay, Staten Island, NY R+56
- Robinvale, Metuchen, NJ D+36
Neighborhoods with Similar Populations
- Highland, Austin, TX D+61
- Flosden, Vallejo, CA D+26
- Hampden, Denver, CO D+47
- East Ridge-Ptarmigan Park, Aurora, CO D+34
- North Springfield, Springfield, VA D+26
- Hikes Point, Louisville, KY D+15
- Rancho Buena, Tucson, AZ D+32
- Goddard, Seabrook, MD D+71
- Cazenovia Park, Buffalo, NY D+12
- North Division, Milwaukee, WI D+86
Sources and methodology
Precinct-level voting records used to fit the model come from New Jersey Division of Elections, distributed by the Voting and Election Science Team. Demographic inputs come from the U.S. Census Bureau (ACS 5-year estimates and the 2020 Decennial Census). Health and environmental inputs come from the CDC (PLACES and the Environmental Justice Index). Land cover comes from the USGS and EPA. Election-day and lead-up weather come from PRISM 4km daily grids and the NOAA Global Historical Climatology Network. Mail-voting and election-administration patterns come from the MIT Election Lab's Survey of the Performance of American Elections. Block-group crime detail comes from CrimeGrade. Internet data and modeling support provided by ISPreports.org.
Modeling and analysis by the BestNeighborhood data science team. Full methodology and findings: political spectrum map.
Methodology reviewed by the BestNeighborhood data team. Last updated May 2026.