Lake City is a Republican stronghold. About 25% of voters here vote Democratic and 75% Republican.
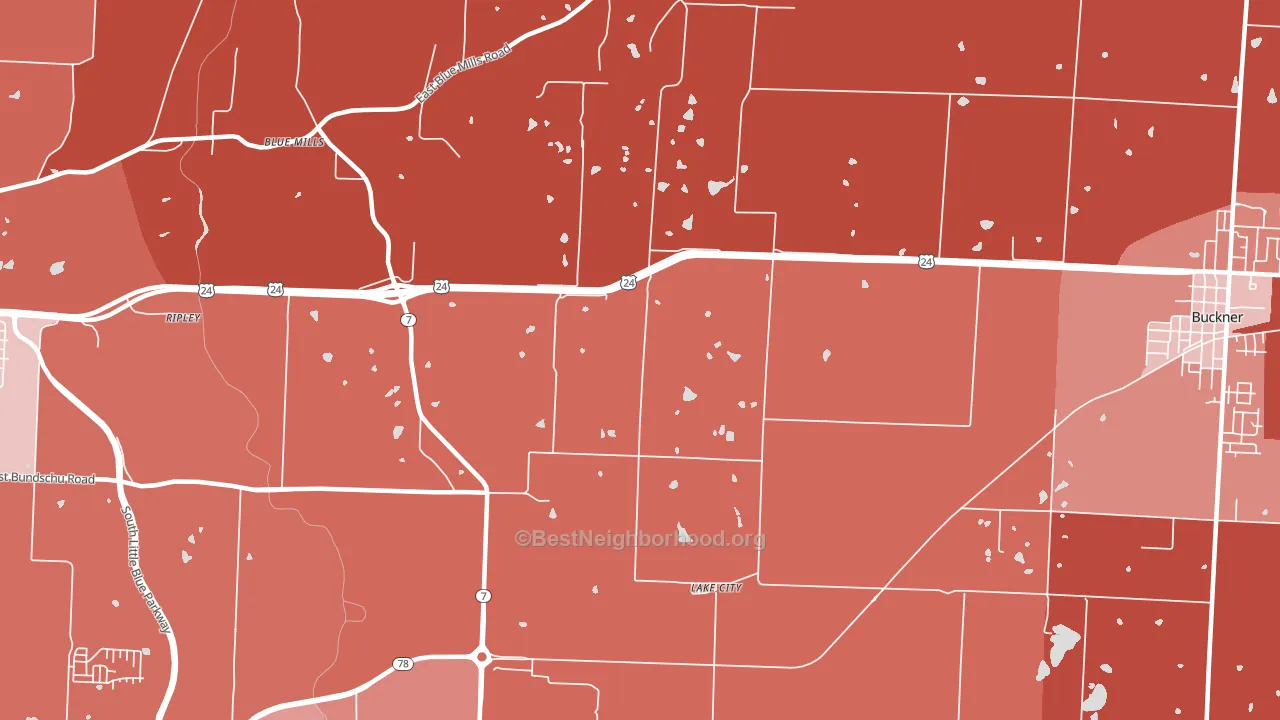
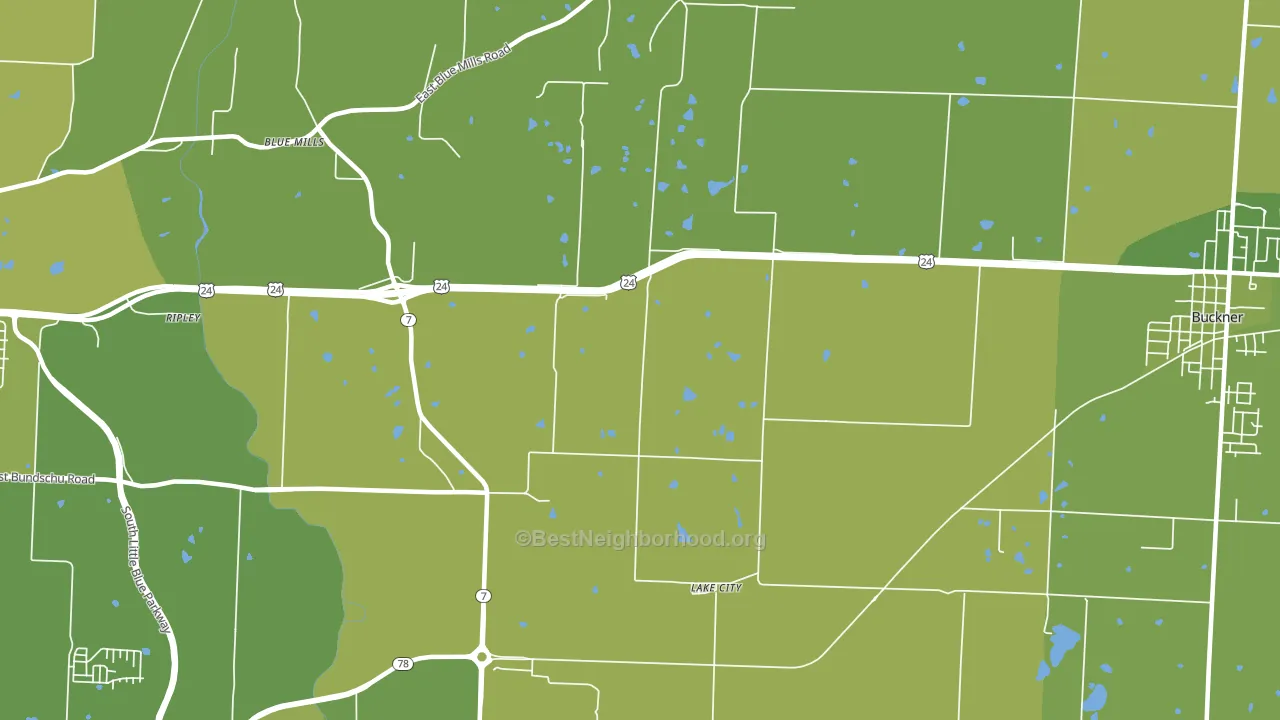
About 75% of adults in Lake City typically vote, above the U.S. average of about 62%. Among adults in Lake City, ~19% vote Democratic, ~56% Republican, and ~25% don't vote. The map below shows estimated turnout by block group.
How Lake City compares
Among cities within 25 miles, Lake City leans more Republican than 59 of 83 neighbors.
Lake City runs about 32 points more Republican than Missouri as a whole.
Why Lake City leans the way it does
This analysis examined 14,881 data points per city to find what predicts political lean and turnout. The items below are a few correlations that stood out for Lake City, not a ranked or complete list of what matters most.
Areas with many family households vote Republican. About 82% of households in Lake City are family households, about 16 points above the U.S. average of 67%.
Preventive-care access and voter turnout
Places with strong routine preventive-care access tend to turn out at a higher rate; Lake City, MO sits above the national average on this measure. Dental visits do not drive turnout; the rate reflects income, insurance, and healthcare access, which line up with who votes.
Why turnout in Lake City looks the way it does
Homeowners vote more often than renters. About 93% of households in Lake City own their home, about 15 points above the Missouri average of 78%. Learn more about the findings and methodology on the political spectrum map.
Nearby Cities
- Buckner, MO R+38
- Sibley, MO R+55
- Levasy, MO R+57
- Excelsior Springs Junction, MO R+51
- Blue Springs, MO R+7
- Independence, MO Even
- Lake Tapawingo, MO Even
- Grain Valley, MO R+26
- Sugar Creek, MO R+12
Cities with Similar Populations
- Imbler, OR R+55
- North Washington, CO Even
- Loveland Heights, CO D+11
- Cesar Chavez, TX Even
- Terra Ceia, NC R+47
- Gilman City, MO R+72
- Marblemount, WA R+18
- Herbert Springs, MS R+85
- Lime Ridge, WI R+38
- Jetson, KY R+74
Sources and methodology
Precinct-level voting records used to fit the model come from Missouri Secretary of State, Elections, distributed by the Voting and Election Science Team. Demographic inputs come from the U.S. Census Bureau (ACS 5-year estimates and the 2020 Decennial Census). Health and environmental inputs come from the CDC (PLACES and the Environmental Justice Index). Land cover comes from the USGS and EPA. Election-day and lead-up weather come from PRISM 4km daily grids and the NOAA Global Historical Climatology Network. Mail-voting and election-administration patterns come from the MIT Election Lab's Survey of the Performance of American Elections. Block-group crime detail comes from CrimeGrade. Internet data and modeling support provided by ISPreports.org.
Modeling and analysis by the BestNeighborhood data science team. Full methodology and findings: political spectrum map.
Methodology reviewed by the BestNeighborhood data team. Last updated May 2026.