Lake Hughes leans Republican by roughly 28 points: about 36% of voters vote Democratic and 64% Republican.
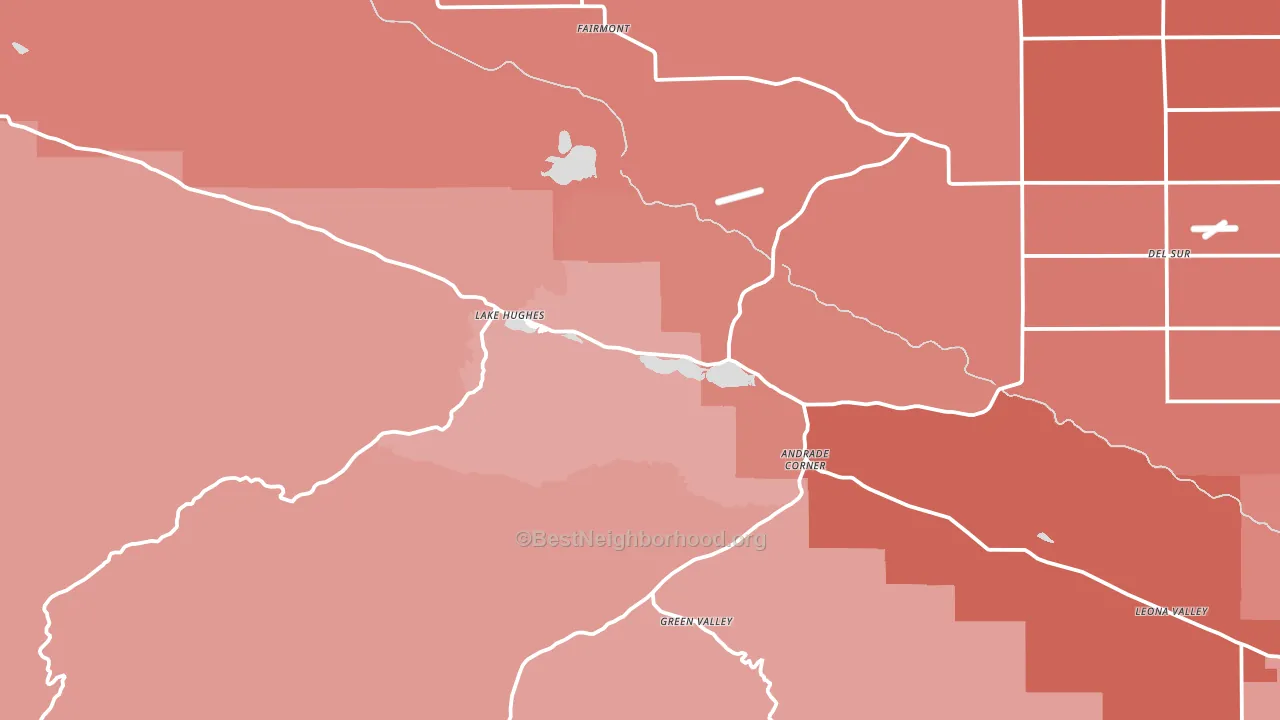
About 53% of adults in Lake Hughes typically vote, below the U.S. average of about 62%. Among adults in Lake Hughes, ~19% vote Democratic, ~34% Republican, and ~47% don't vote. The map below shows estimated turnout by block group.
How Lake Hughes compares
Among cities within 25 miles, Lake Hughes leans more Republican than 10 of 17 neighbors.
Lake Hughes runs about 47 points more Republican than California as a whole. California leans Democratic overall, while Lake Hughes is one of the few Republican-leaning pockets.
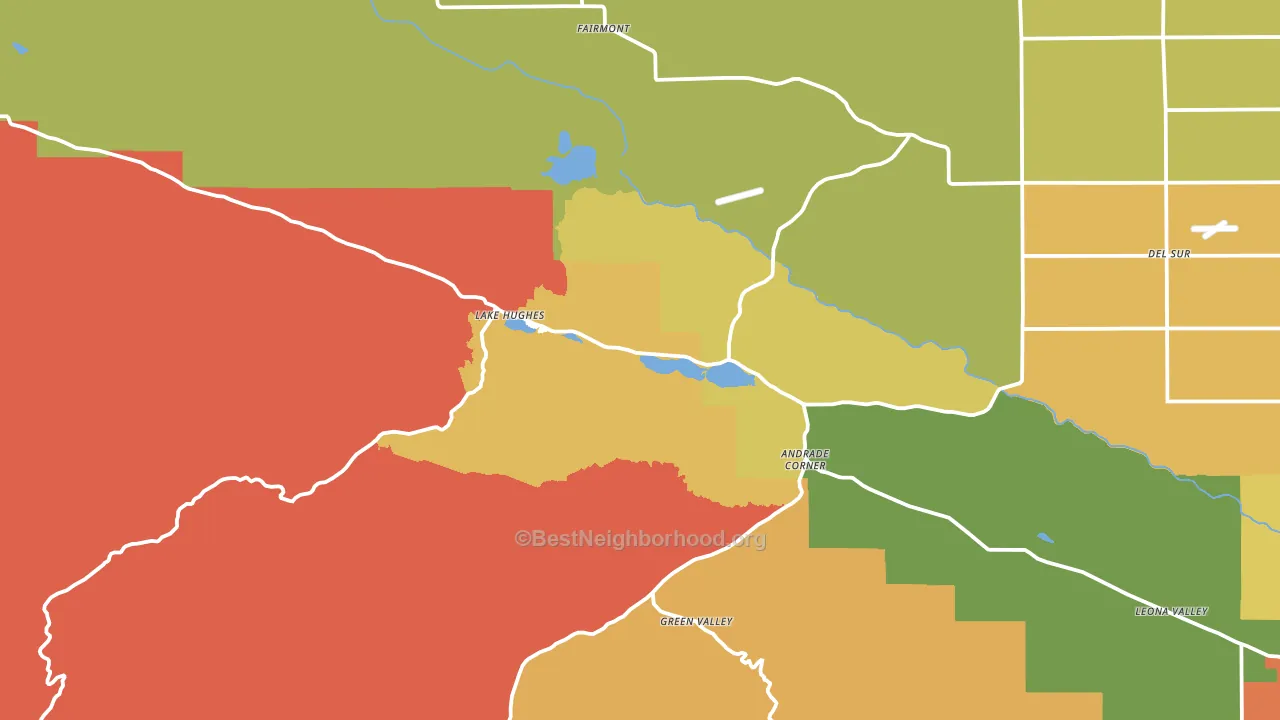
Politics vary noticeably by neighborhood within Lake Hughes. The east side is the most Republican-leaning (R+33) and the west side is the least Republican-leaning (R+10), a spread of about 23 points.
Why Lake Hughes leans the way it does
This analysis examined 14,881 data points per city to find what predicts political lean and turnout. The items below are a few correlations that stood out for Lake Hughes, not a ranked or complete list of what matters most.
Lake Hughes votes against the grain of California. California leans Democratic overall, while Lake Hughes runs about 47 points more Republican.
Never-married share and voter turnout
Places with a never-married-heavy adult population tend to turn out at a lower rate; Lake Hughes, CA sits in the top tenth nationally on this measure.
Why turnout in Lake Hughes looks the way it does
Crowded housing lines up with lower turnout. About 5% of homes in Lake Hughes have more than one occupant per room, above 87% of cities. Learn more about the findings and methodology on the political spectrum map.
Nearby Cities
- Del Sur, CA R+33
- Leona Valley, CA R+39
- Three Points, CA R+32
- Quartz Hill, CA R+16
- Agua Dulce, CA R+36
- Willow Springs, CA R+41
- Lancaster, CA D+14
- Santa Clarita, CA Even
- Canyon Country, CA D+3
- Castaic, CA R+7
Cities with Similar Populations
- Brasher Falls, NY R+36
- Milford Center, OH R+55
- Honaunau-Napoopoo, HI D+21
- Liverpool, TX R+62
- Richmondville, NY R+34
- Barryton, MI R+41
- Jetersville, VA R+44
- Hurley, WI R+27
- Bethel, ME Even
- Alpine, WY R+53
Sources and methodology
Precinct-level voting records used to fit the model come from California Secretary of State, Elections, distributed by the Voting and Election Science Team. Demographic inputs come from the U.S. Census Bureau (ACS 5-year estimates and the 2020 Decennial Census). Health and environmental inputs come from the CDC (PLACES and the Environmental Justice Index). Land cover comes from the USGS and EPA. Election-day and lead-up weather come from PRISM 4km daily grids and the NOAA Global Historical Climatology Network. Mail-voting and election-administration patterns come from the MIT Election Lab's Survey of the Performance of American Elections. Block-group crime detail comes from CrimeGrade. Internet data and modeling support provided by ISPreports.org.
Modeling and analysis by the BestNeighborhood data science team. Full methodology and findings: political spectrum map.
Methodology reviewed by the BestNeighborhood data team. Last updated May 2026.