Lakeside-Lester Park leans heavily Democratic by roughly 40 points: about 70% of voters vote Democratic and 30% Republican.
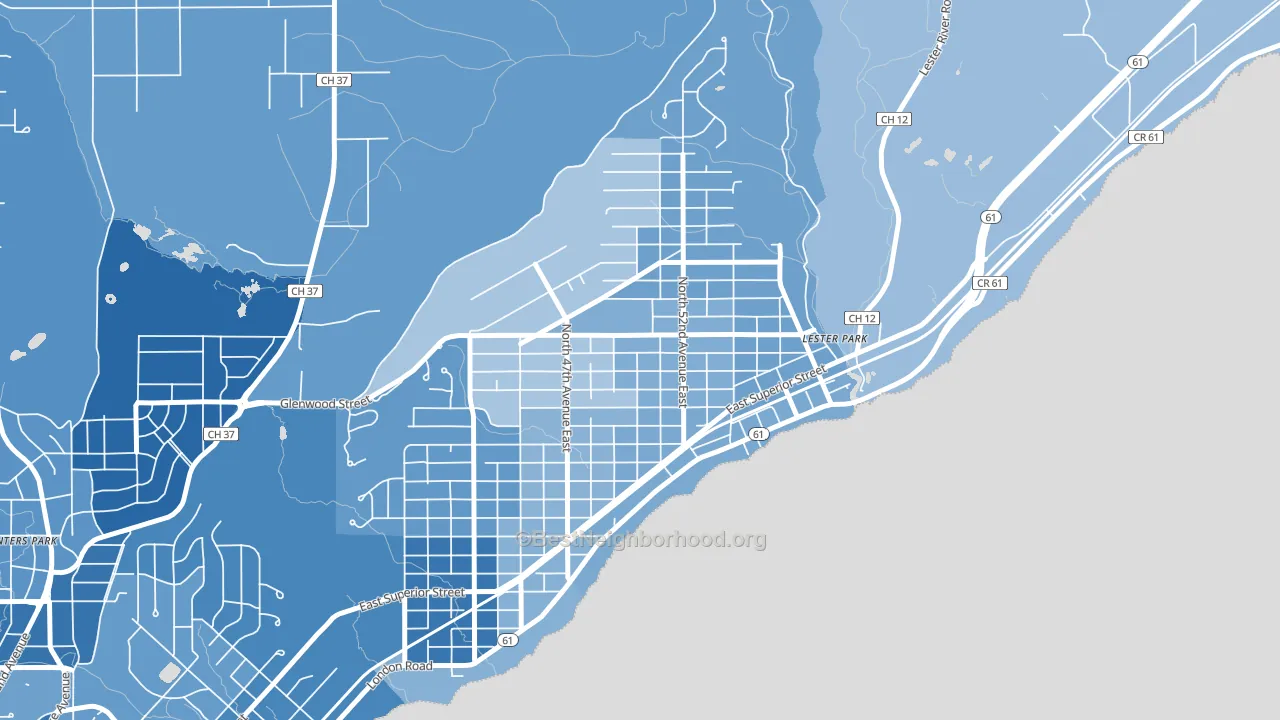
About more than 99% of adults in Lakeside-Lester Park typically vote, above the U.S. average of about 62%. Among adults in Lakeside-Lester Park, ~69% vote Democratic, ~30% Republican, and ~1% don't vote. The map below shows estimated turnout by block group.
How Lakeside-Lester Park compares
Among neighborhoods within 5 miles, Lakeside-Lester Park leans more Democratic than 2 of 4 neighbors.
Lakeside-Lester Park runs about 35 points more Democratic than Minnesota as a whole.
Why Lakeside-Lester Park leans the way it does
Density, race composition, education, and family structure all sit close to their national averages in Lakeside-Lester Park. The lean here lands roughly where demographic data alone would predict.
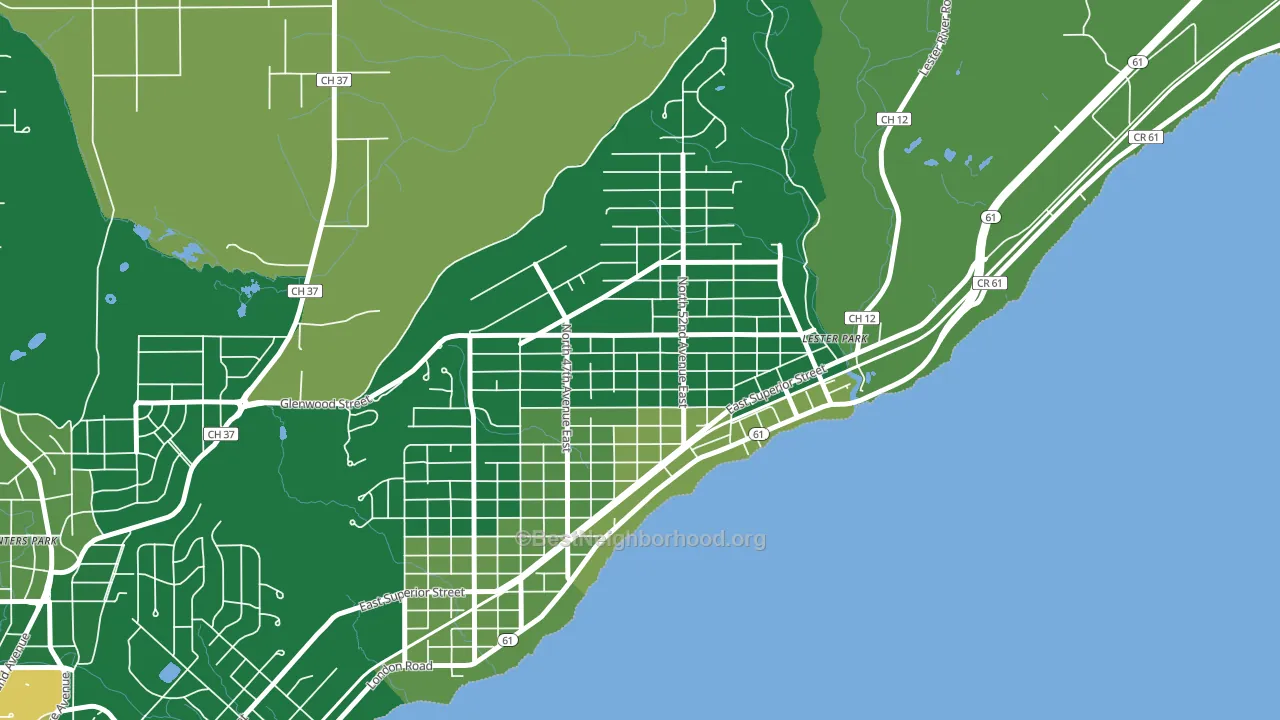
High-school completion, developed land, and voter turnout
Places that combine high-school-completion-heavy adults and a rural land-use pattern tend to turn out at a higher rate, as Lakeside-Lester Park, Duluth, MN does.
Why turnout in Lakeside-Lester Park looks the way it does
Areas with strong routine healthcare access turn out at higher rates. Lakeside-Lester Park is in the top quarter nationally for routine-care measures such as insurance coverage, preventive screenings, and dental visits. The dental-visit rate here is about 72%, about 12 points above the U.S. average of 60%. Homeowners vote more often than renters, and about 86% of households in Lakeside-Lester Park own their home, compared to around 56% in nearby neighborhoods. Learn more about the findings and methodology on the political spectrum map.
Nearby Neighborhoods
- Congdon Park, Duluth, MN D+53
- Woodlands-Pleasantview, Duluth, MN D+30
- East Hillside, Duluth, MN D+55
- Kenwood-Duluth, Duluth, MN D+30
- Downtown Duluth, Duluth, MN D+45
- Duluth Heights, Duluth, MN D+16
- West End, Duluth, MN D+32
- Central Park, Superior, WI D+12
- Downtown, Superior, WI D+12
- Spirit Valley-Denfeld-Norton Park, Duluth, MN D+20
Neighborhoods with Similar Populations
- Old Savannah, Augusta, GA D+40
- Hansen, Mountain House, CA D+15
- North Heights, Youngstown, OH D+57
- Perris Hills, San Bernardino, CA D+26
- Northside Northline, Houston, TX D+32
- Cornerstone Village, Santa Ana, CA D+29
- Royal Crown Estates, Novi, MI D+6
- The West Side, Eureka, CA D+37
- Oakdale Farms, Norfolk, VA D+28
- McGirts Creek, Jacksonville, FL D+19
Sources and methodology
Precinct-level voting records used to fit the model come from Minnesota Secretary of State, Elections, distributed by the Voting and Election Science Team. Demographic inputs come from the U.S. Census Bureau (ACS 5-year estimates and the 2020 Decennial Census). Health and environmental inputs come from the CDC (PLACES and the Environmental Justice Index). Land cover comes from the USGS and EPA. Election-day and lead-up weather come from PRISM 4km daily grids and the NOAA Global Historical Climatology Network. Mail-voting and election-administration patterns come from the MIT Election Lab's Survey of the Performance of American Elections. Block-group crime detail comes from CrimeGrade. Internet data and modeling support provided by ISPreports.org.
Modeling and analysis by the BestNeighborhood data science team. Full methodology and findings: political spectrum map.
Methodology reviewed by the BestNeighborhood data team. Last updated May 2026.