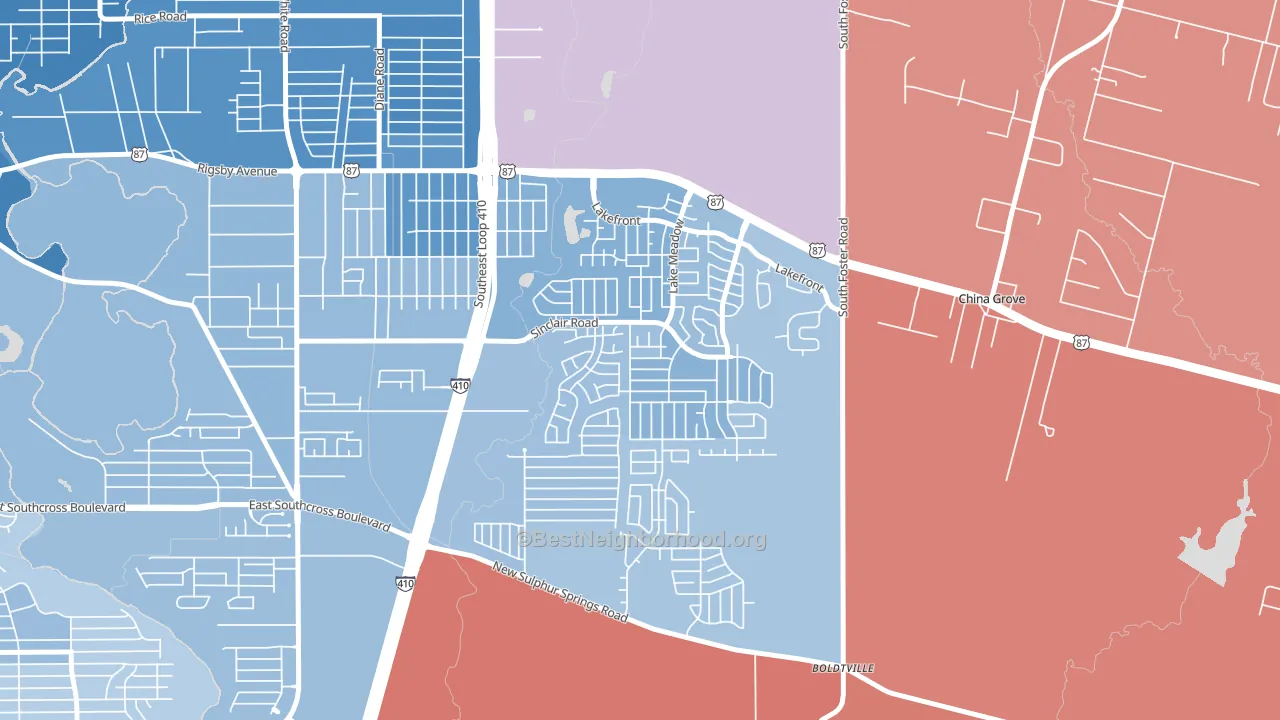
Lakeside leans Democratic by roughly 24 points: about 62% of voters vote Democratic and 38% Republican.
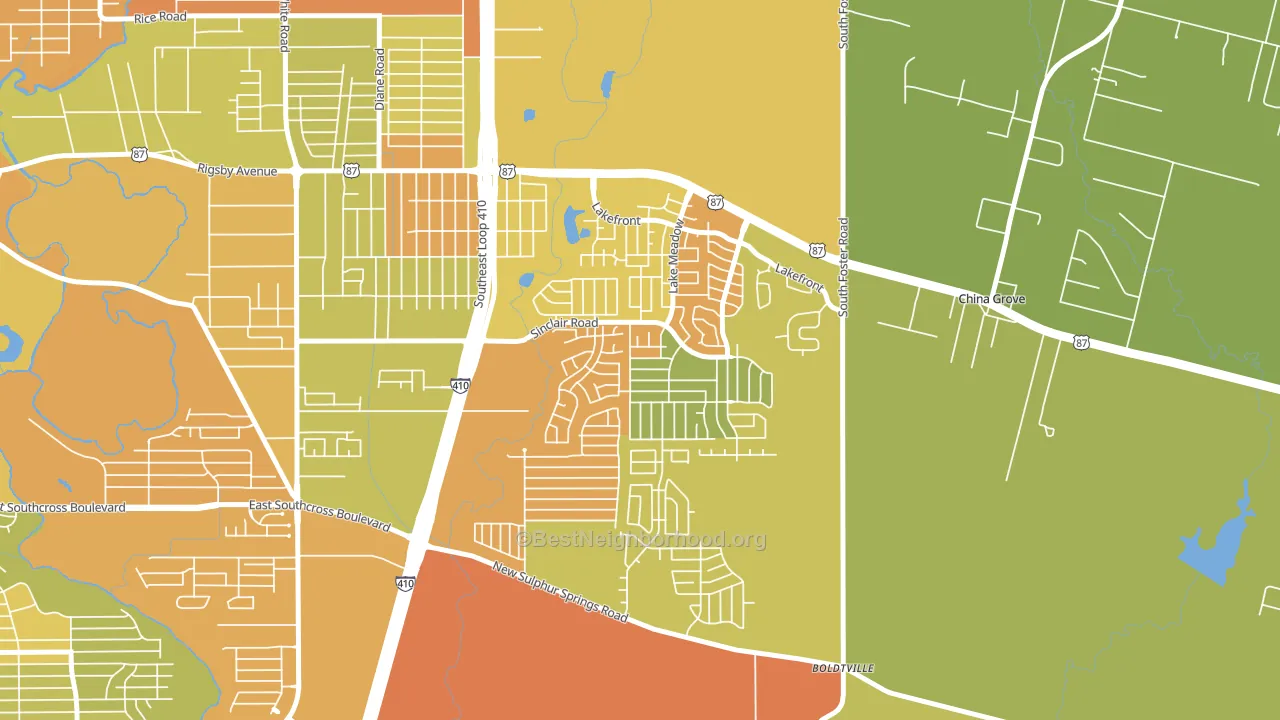
About 44% of adults in Lakeside typically vote, below the U.S. average of about 62%. Among adults in Lakeside, ~27% vote Democratic, ~17% Republican, and ~56% don't vote. The map below shows estimated turnout by block group.
How Lakeside compares
Among neighborhoods within 5 miles, Lakeside leans more Democratic than 1 of 6 neighbors.
Lakeside runs about 38 points more Democratic than Texas as a whole. Texas leans Republican overall, while Lakeside is one of the few Democratic-leaning pockets.
Politics vary noticeably by block within Lakeside. The south side is the most Democratic-leaning (D+31) and the northeast side is the least Democratic-leaning (D+19), a spread of about 11 points.
Why Lakeside leans the way it does
This analysis examined 14,881 data points per neighborhood to find what predicts political lean and turnout. The items below are a few correlations that stood out for Lakeside, not a ranked or complete list of what matters most.
Lakeside votes against the grain of Texas. Texas leans Republican overall, while Lakeside runs about 38 points more Democratic.
Population density and Democratic lean
Places with high population density tend to lean Democratic; Lakeside, San Antonio, TX sits in the top quarter nationally on this measure.
Why turnout in Lakeside looks the way it does
Areas with limited routine healthcare access turn out at lower rates. Lakeside is in the bottom quarter nationally for routine-care measures such as insurance coverage, preventive screenings, and dental visits. The uninsured rate here is about 24%, about 6 points above the Texas average of 19%. Learn more about the findings and methodology on the political spectrum map.
Nearby Neighborhoods
- Pecan Valley, San Antonio, TX D+26
- Woodbridge at Monte Viejo, San Antonio, TX D+9
- Highland Hills, San Antonio, TX D+25
- Sunny Slope, San Antonio, TX D+35
- Candlewood Park, San Antonio, TX D+29
- Arena District, San Antonio, TX D+44
- Highland Park, San Antonio, TX D+34
- Hot Wells, San Antonio, TX D+29
- Jefferson Heights, San Antonio, TX D+49
- Denver Heights, San Antonio, TX D+41
Neighborhoods with Similar Populations
- Sherman Heights, San Diego, CA D+45
- Merritt, Oakland, CA D+64
- Bay Farm Island, Alameda, CA D+51
- Downtown, Washington, DC D+71
- Midway-Coldstream, Baltimore, MD D+85
- Sunbow, Chula Vista, CA D+18
- Beaverdale, Des Moines, IA D+39
- Zilker, Austin, TX D+45
- Central Business District, Kansas City, MO D+51
- Northeast Durham, Durham, NC D+51
Sources and methodology
Precinct-level voting records used to fit the model come from Texas Secretary of State, Elections Division, distributed by the Voting and Election Science Team. Demographic inputs come from the U.S. Census Bureau (ACS 5-year estimates and the 2020 Decennial Census). Health and environmental inputs come from the CDC (PLACES and the Environmental Justice Index). Land cover comes from the USGS and EPA. Election-day and lead-up weather come from PRISM 4km daily grids and the NOAA Global Historical Climatology Network. Mail-voting and election-administration patterns come from the MIT Election Lab's Survey of the Performance of American Elections. Block-group crime detail comes from CrimeGrade. Internet data and modeling support provided by ISPreports.org.
Modeling and analysis by the BestNeighborhood data science team. Full methodology and findings: political spectrum map.
Methodology reviewed by the BestNeighborhood data team. Last updated May 2026.