Sunbow leans Democratic by roughly 18 points: about 59% of voters vote Democratic and 41% Republican.
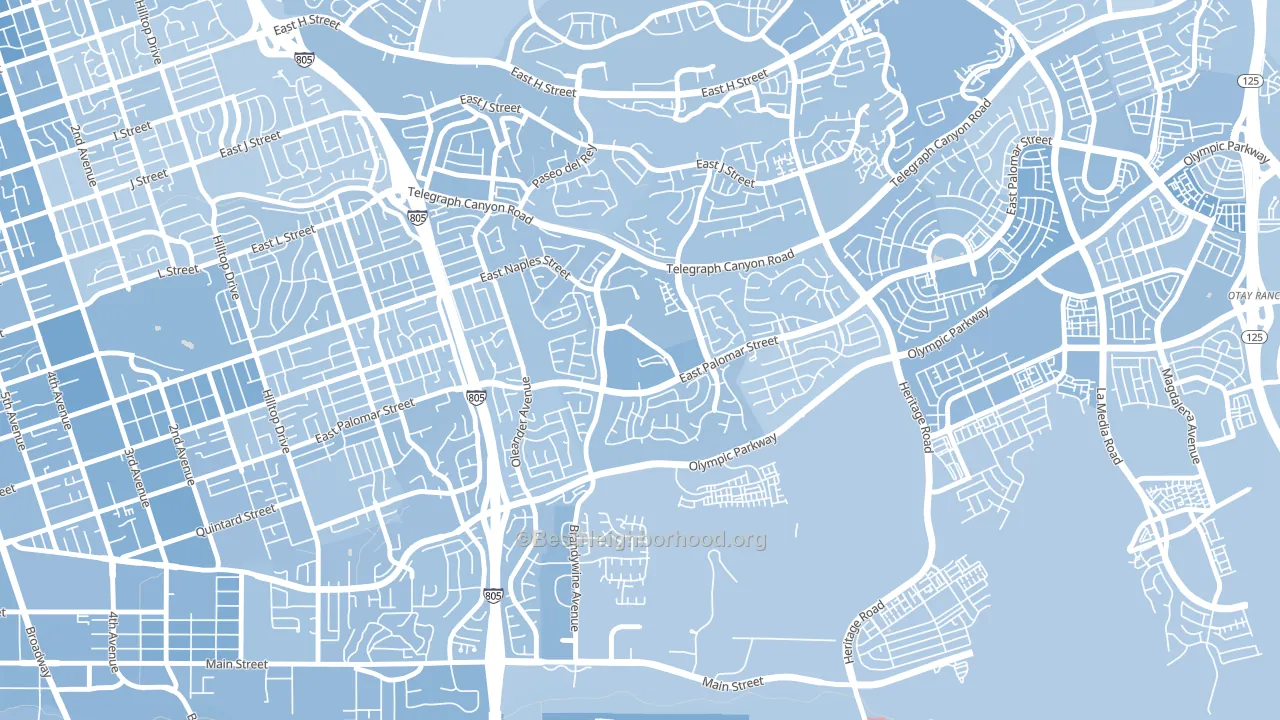
About 59% of adults in Sunbow typically vote, near the U.S. average of about 62%. Among adults in Sunbow, ~35% vote Democratic, ~24% Republican, and ~41% don't vote. The map below shows estimated turnout by block group.
How Sunbow compares
Among neighborhoods within 5 miles, Sunbow leans more Democratic than 10 of 17 neighbors.
Politically, Sunbow sits close to the rest of California.
Why Sunbow leans the way it does
Density, race composition, education, and family structure all sit close to their national averages in Sunbow. The lean here lands roughly where demographic data alone would predict.
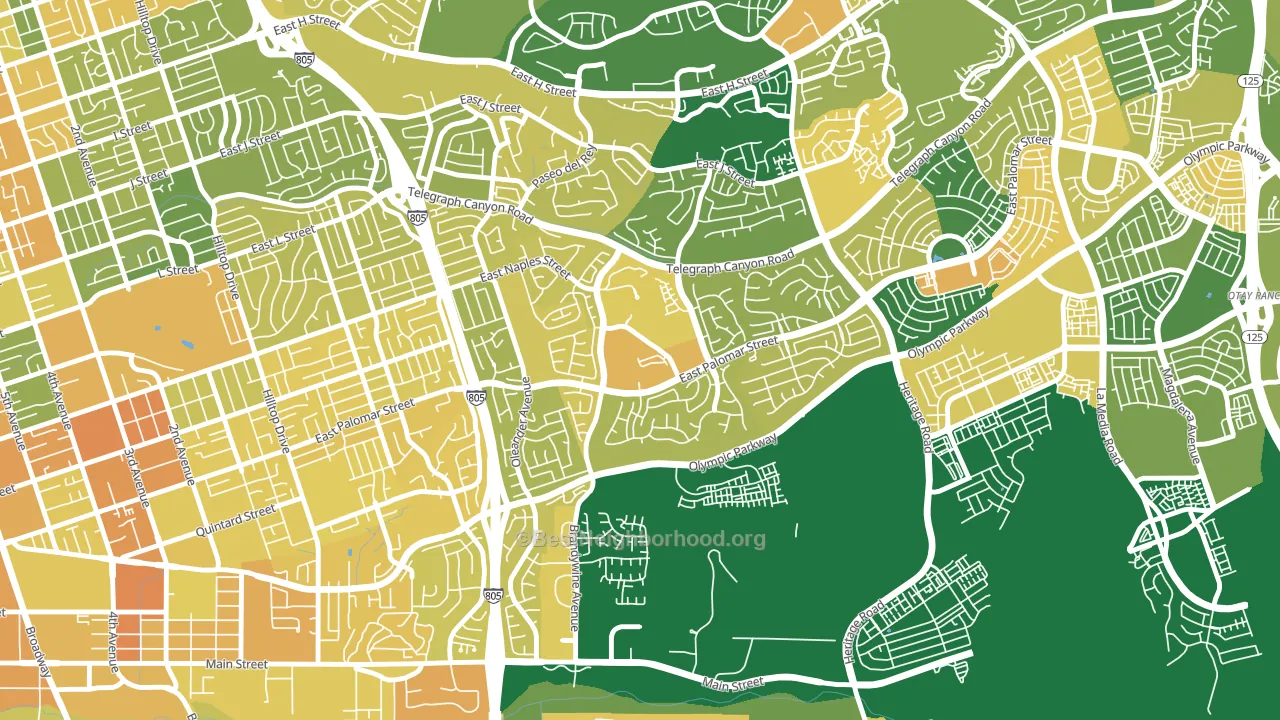
Paved land cover and Democratic lean
Places with extensive paved surfaces tend to lean Democratic; Sunbow, Chula Vista, CA sits in the top quarter nationally on this measure. Paved ground does not change how people vote; it mostly reflects how urban and built-up a place is.
Why turnout in Sunbow looks the way it does
Crowded housing lines up with lower turnout. About 11% of homes in Sunbow have more than one occupant per room, above 92% of neighborhoods. Learn more about the findings and methodology on the political spectrum map.
Nearby Neighborhoods
- Lynwood Hills, Chula Vista, CA D+16
- Paseo Ranchoero, Chula Vista, CA D+16
- Rancho del Rey, Chula Vista, CA D+15
- Terra Nova, Chula Vista, CA D+14
- Otay Ranch, Chula Vista, CA D+16
- Bonita Long Canyon, Bonita, CA D+7
- Otay Mesa West, San Diego, CA D+20
- Boal, Chula Vista, CA D+23
- East Lake, Chula Vista, CA D+16
- Downtown Chula Vista, Chula Vista, CA D+26
Neighborhoods with Similar Populations
- Beaverdale, Des Moines, IA D+39
- Downtown, Washington, DC D+71
- Bay Farm Island, Alameda, CA D+51
- Northeast Durham, Durham, NC D+51
- Merritt, Oakland, CA D+64
- Sherman Heights, San Diego, CA D+45
- Lakeside, San Antonio, TX D+24
- Holly, Everett, WA D+17
- Desert Hills, Las Vegas, NV R+5
- Midway-Coldstream, Baltimore, MD D+85
Sources and methodology
Precinct-level voting records used to fit the model come from California Secretary of State, Elections, distributed by the Voting and Election Science Team. Demographic inputs come from the U.S. Census Bureau (ACS 5-year estimates and the 2020 Decennial Census). Health and environmental inputs come from the CDC (PLACES and the Environmental Justice Index). Land cover comes from the USGS and EPA. Election-day and lead-up weather come from PRISM 4km daily grids and the NOAA Global Historical Climatology Network. Mail-voting and election-administration patterns come from the MIT Election Lab's Survey of the Performance of American Elections. Block-group crime detail comes from CrimeGrade. Internet data and modeling support provided by ISPreports.org.
Modeling and analysis by the BestNeighborhood data science team. Full methodology and findings: political spectrum map.
Methodology reviewed by the BestNeighborhood data team. Last updated May 2026.