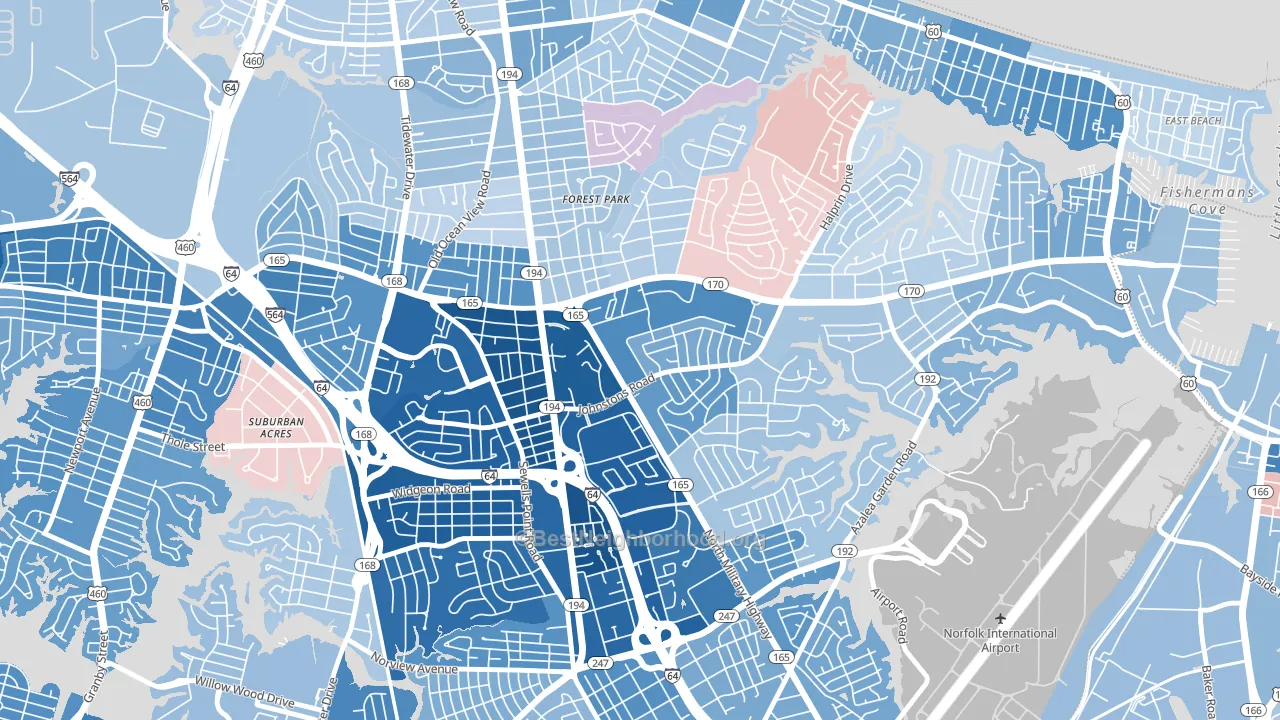
Larrymore Lawns is a Democratic stronghold. About 79% of voters here vote Democratic and 21% Republican.
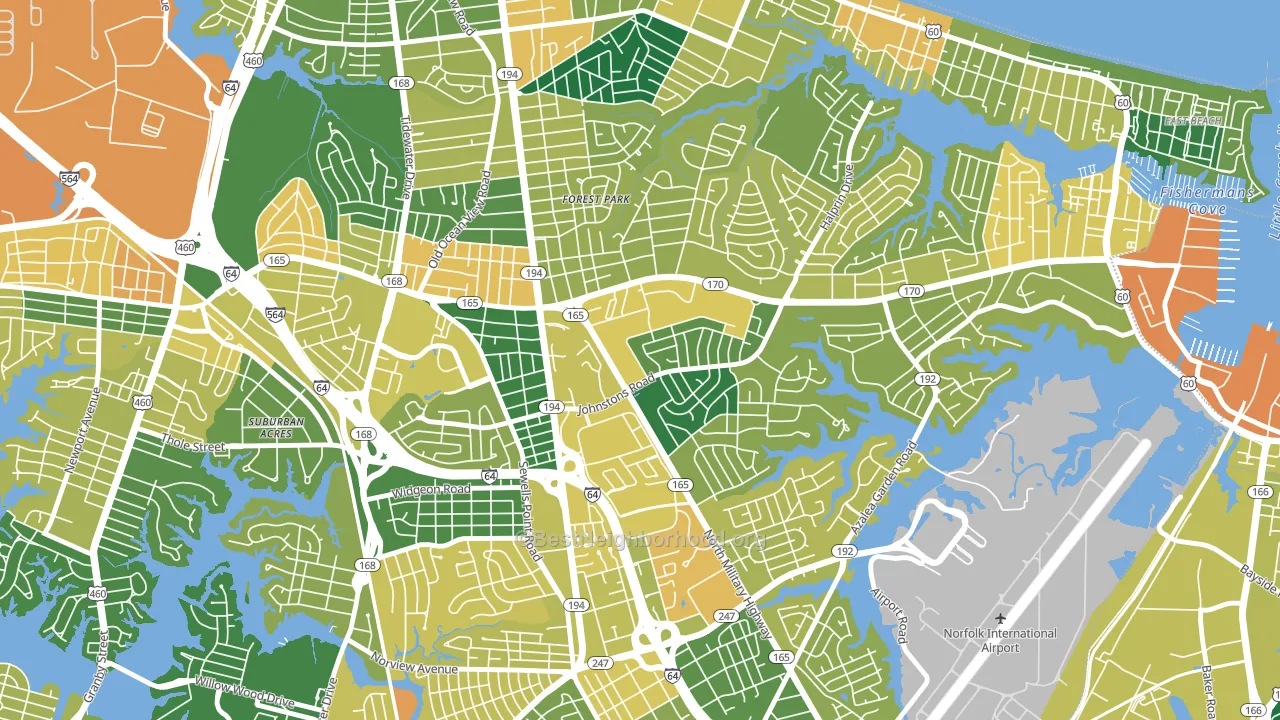
About 62% of adults in Larrymore Lawns typically vote, near the U.S. average of about 62%. Among adults in Larrymore Lawns, ~49% vote Democratic, ~13% Republican, and ~38% don't vote. The map below shows estimated turnout by block group.
How Larrymore Lawns compares
Among neighborhoods within 5 miles, Larrymore Lawns leans more Democratic than 11 of 19 neighbors.
Larrymore Lawns runs about 52 points more Democratic than Virginia as a whole.
Politics vary noticeably by block within Larrymore Lawns. The southwest side is the most Democratic-leaning (D+79) and the southeast side is the least Democratic-leaning (D+25), a spread of about 54 points.
Why Larrymore Lawns leans the way it does
Density, race composition, education, and family structure all sit close to their national averages in Larrymore Lawns. The lean here lands roughly where demographic data alone would predict.
Paved land cover and Democratic lean
Places with extensive paved surfaces tend to lean Democratic; Larrymore Lawns, Norfolk, VA sits in the top quarter nationally on this measure. Paved ground does not change how people vote; it mostly reflects how urban and built-up a place is.
Why turnout in Larrymore Lawns looks the way it does
Areas with strong routine healthcare access turn out at higher rates. Larrymore Lawns is in the top quarter nationally for routine-care measures such as insurance coverage, preventive screenings, and dental visits. The dental-visit rate here is about 61%. Learn more about the findings and methodology on the political spectrum map.
Nearby Neighborhoods
- Roosevelt Gardens Area, Norfolk, VA R+8
- Oakdale Farms, Norfolk, VA D+28
- Bay View, Norfolk, VA D+19
- Suburban Acres, Norfolk, VA D+36
- East Ocean View, Norfolk, VA D+17
- Fairmont Park, Norfolk, VA D+63
- West Ocean View, Norfolk, VA D+25
- Ballentine Place, Norfolk, VA D+68
- Colonial Place Riverview, Norfolk, VA D+61
- Lindenwood, Norfolk, VA D+80
Neighborhoods with Similar Populations
- Eastern 49-63, Kansas City, MO D+72
- Wood Park, Tempe, AZ D+30
- Far North Dallas-Roanoke, Roanoke, TX R+16
- Atlantic Boulevard Estates, Jacksonville, FL D+4
- Greenfield, Bakersfield, CA D+2
- Highlands, Boise, ID D+20
- Wrightsboro, Wilmington, NC R+3
- Terrace Hills, Mobile, AL R+12
- Norwood Park, Dundalk, MD R+14
- Garden District, Baton Rouge, LA D+63
Sources and methodology
Precinct-level voting records used to fit the model come from Virginia Department of Elections, distributed by the Voting and Election Science Team. Demographic inputs come from the U.S. Census Bureau (ACS 5-year estimates and the 2020 Decennial Census). Health and environmental inputs come from the CDC (PLACES and the Environmental Justice Index). Land cover comes from the USGS and EPA. Election-day and lead-up weather come from PRISM 4km daily grids and the NOAA Global Historical Climatology Network. Mail-voting and election-administration patterns come from the MIT Election Lab's Survey of the Performance of American Elections. Block-group crime detail comes from CrimeGrade. Internet data and modeling support provided by ISPreports.org.
Modeling and analysis by the BestNeighborhood data science team. Full methodology and findings: political spectrum map.
Methodology reviewed by the BestNeighborhood data team. Last updated May 2026.