Eastern 49-63 is a Democratic stronghold. About 86% of voters here vote Democratic and 14% Republican.
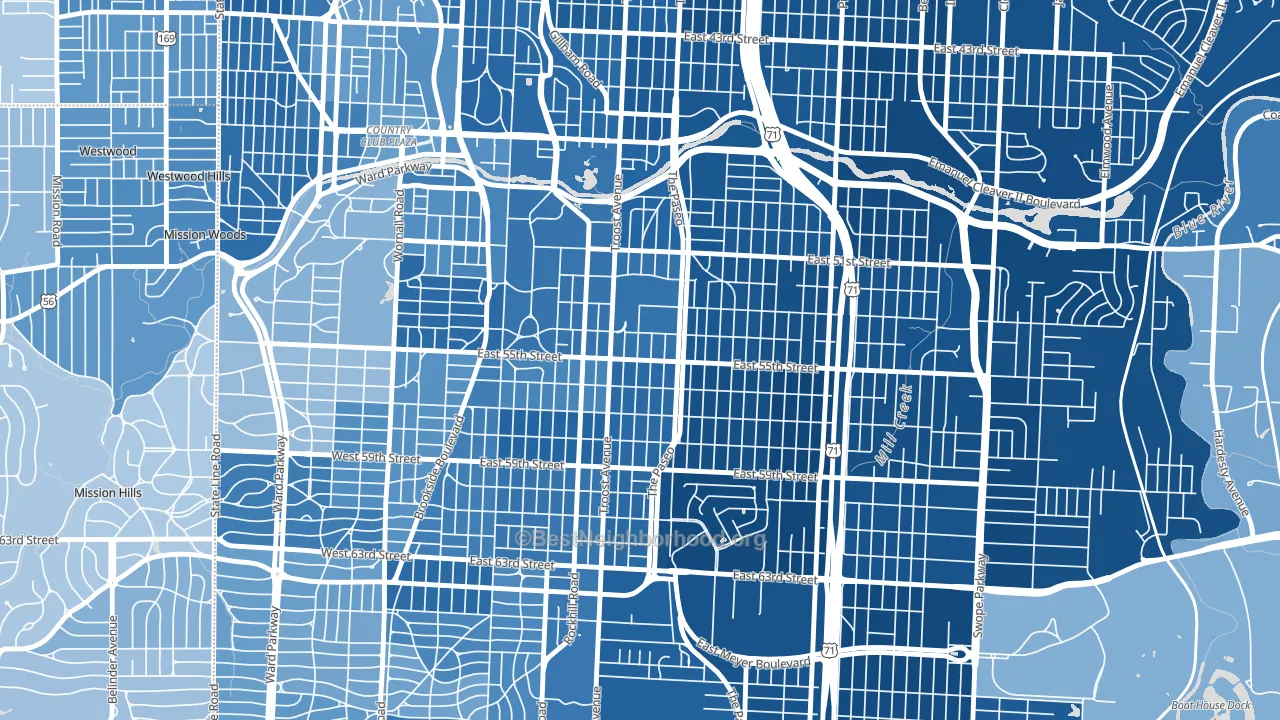
About 45% of adults in Eastern 49-63 typically vote, below the U.S. average of about 62%. Among adults in Eastern 49-63, ~38% vote Democratic, ~6% Republican, and ~56% don't vote. The map below shows estimated turnout by block group.
How Eastern 49-63 compares
Among neighborhoods within 5 miles, Eastern 49-63 leans more Democratic than 12 of 17 neighbors.
Eastern 49-63 runs about 90 points more Democratic than Missouri as a whole. Missouri leans Republican overall, while Eastern 49-63 is one of the few Democratic-leaning pockets.
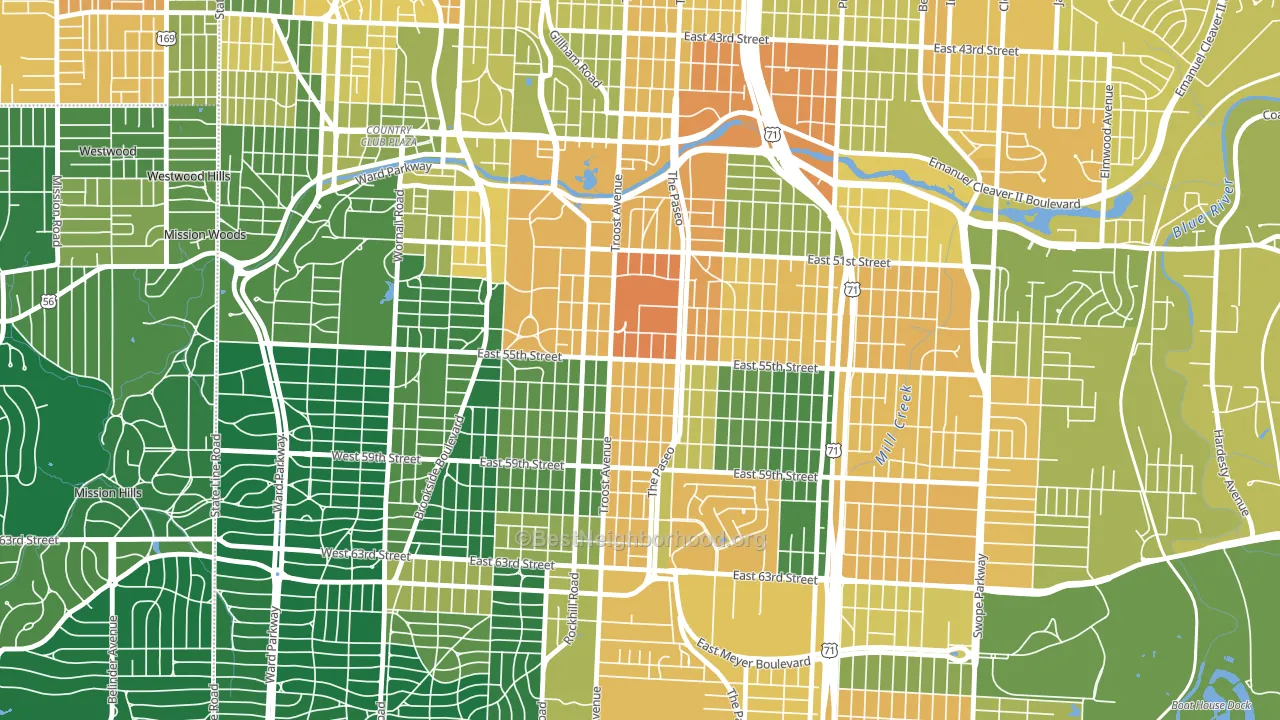
Politics vary noticeably by block within Eastern 49-63. The southeast side is the most Democratic-leaning (D+85) and the west side is the least Democratic-leaning (D+65), a spread of about 20 points.
Why Eastern 49-63 leans the way it does
This analysis examined 14,881 data points per neighborhood to find what predicts political lean and turnout. The items below are a few correlations that stood out for Eastern 49-63, not a ranked or complete list of what matters most.
Dense areas vote Democratic. More than 99% of residents in Eastern 49-63 live in densely developed areas, about 64 points above the U.S. average of 36%. A high never-married share predicts Democratic voting, and about 64% of adults in Eastern 49-63 have never been married, above 95% of neighborhoods. Eastern 49-63 runs against the grain of Missouri, a Democratic-leaning pocket in a Republican-leaning state.
Never-married share, developed land, and voter turnout
Places that combine a never-married-heavy adult population and a heavily developed built environment tend to turn out at a lower rate, as Eastern 49-63, Kansas City, MO does.
Why turnout in Eastern 49-63 looks the way it does
High-crime urban areas turn out at lower rates, and Eastern 49-63 sits in the top 15% on a violent-crime measure. Learn more about the findings and methodology on the political spectrum map.
Nearby Neighborhoods
- Western 49-63, Kansas City, MO D+64
- Blue Hills, Kansas City, MO D+83
- South Plaza, Kansas City, MO D+51
- North Town Fork Creek, Kansas City, MO D+84
- Southmoreland, Kansas City, MO D+70
- Blenheim Square, Kansas City, MO D+79
- West Plaza, Kansas City, MO D+56
- East Meyer, Kansas City, MO D+80
- Tower Homes, Kansas City, MO D+67
- Oak Park Northwest, Kansas City, MO D+83
Neighborhoods with Similar Populations
- Larrymore Lawns, Norfolk, VA D+58
- Wood Park, Tempe, AZ D+30
- Far North Dallas-Roanoke, Roanoke, TX R+16
- Atlantic Boulevard Estates, Jacksonville, FL D+4
- Greenfield, Bakersfield, CA D+2
- Highlands, Boise, ID D+20
- Terrace Hills, Mobile, AL R+12
- Wrightsboro, Wilmington, NC R+3
- Norwood Park, Dundalk, MD R+14
- Garden District, Baton Rouge, LA D+63
Sources and methodology
Precinct-level voting records used to fit the model come from Missouri Secretary of State, Elections, distributed by the Voting and Election Science Team. Demographic inputs come from the U.S. Census Bureau (ACS 5-year estimates and the 2020 Decennial Census). Health and environmental inputs come from the CDC (PLACES and the Environmental Justice Index). Land cover comes from the USGS and EPA. Election-day and lead-up weather come from PRISM 4km daily grids and the NOAA Global Historical Climatology Network. Mail-voting and election-administration patterns come from the MIT Election Lab's Survey of the Performance of American Elections. Block-group crime detail comes from CrimeGrade. Internet data and modeling support provided by ISPreports.org.
Modeling and analysis by the BestNeighborhood data science team. Full methodology and findings: political spectrum map.
Methodology reviewed by the BestNeighborhood data team. Last updated May 2026.