Loma Mar is a Democratic stronghold. About 76% of voters here vote Democratic and 24% Republican.
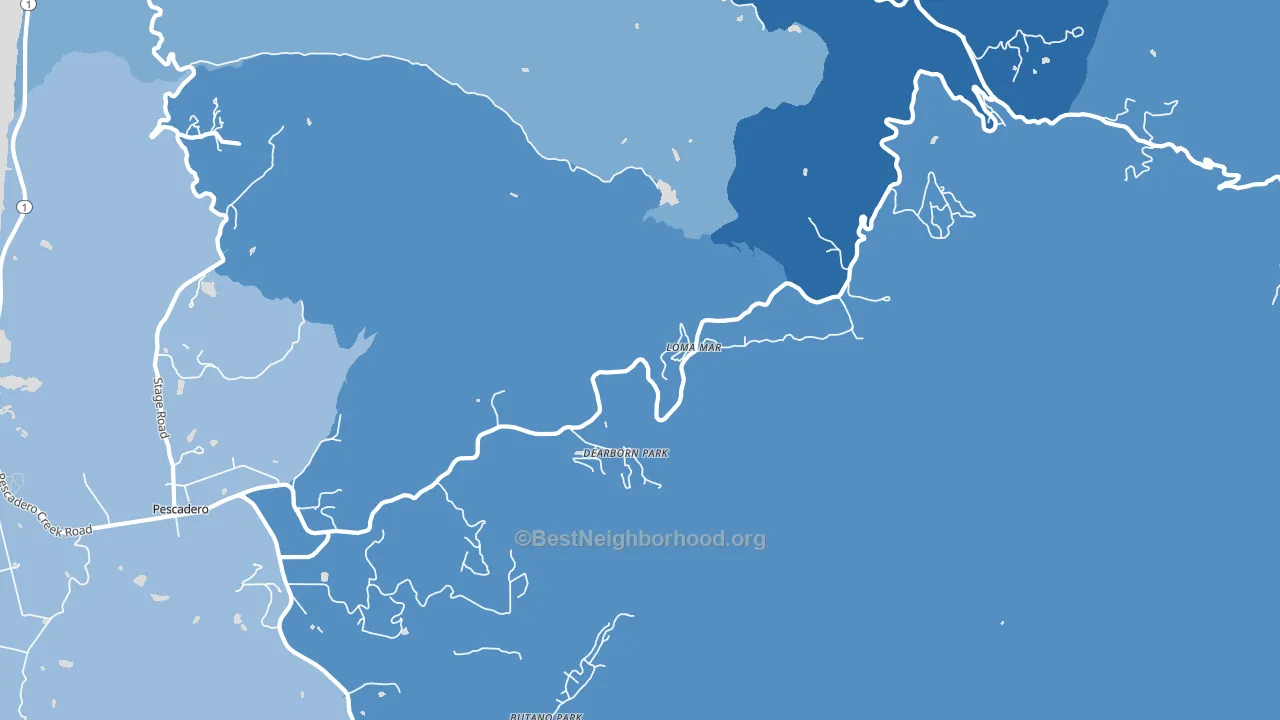
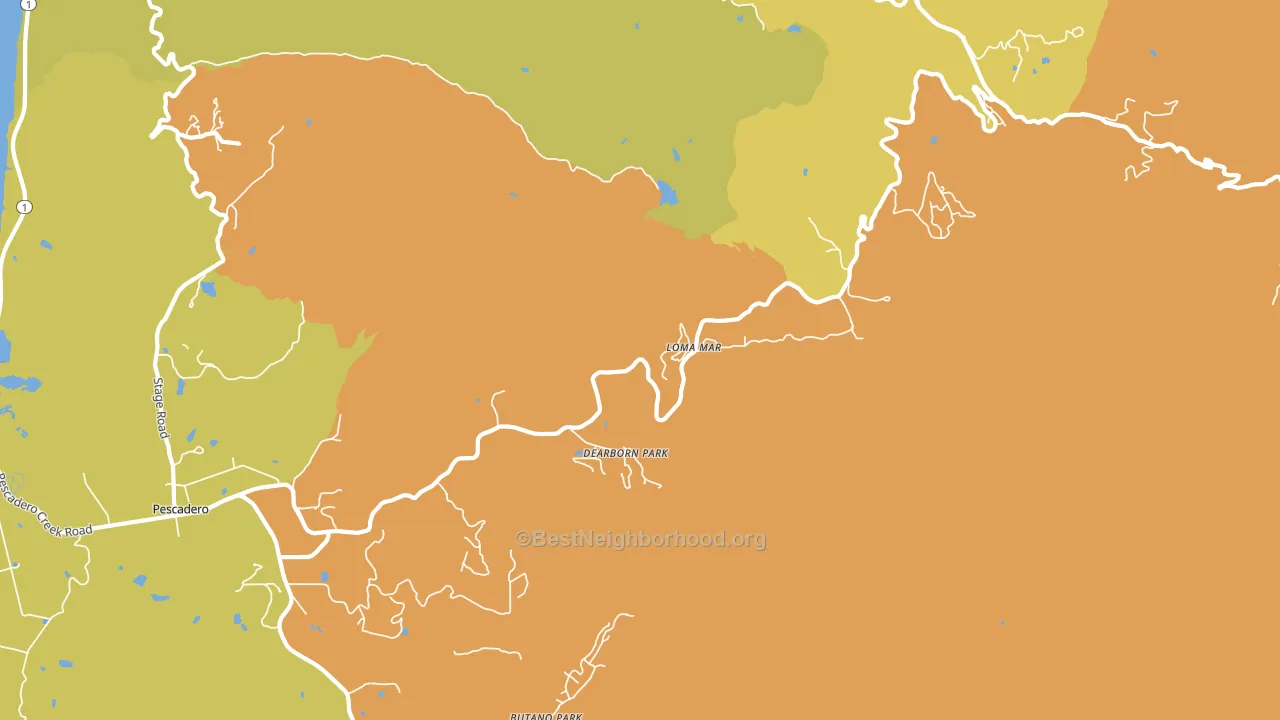
About 42% of adults in Loma Mar typically vote, below the U.S. average of about 62%. Among adults in Loma Mar, ~32% vote Democratic, ~10% Republican, and ~58% don't vote. The map below shows estimated turnout by block group.
How Loma Mar compares
Among cities within 25 miles, Loma Mar leans more Democratic than 44 of 53 neighbors.
Loma Mar runs about 32 points more Democratic than California as a whole.
Why Loma Mar leans the way it does
This analysis examined 14,881 data points per city to find what predicts political lean and turnout. The items below are a few correlations that stood out for Loma Mar, not a ranked or complete list of what matters most.
Areas with high college attainment vote Democratic. About 49% of adults in Loma Mar hold a bachelor's degree, about 21 points above the U.S. average of 28%. A high never-married share predicts Democratic voting, and about 31% of adults in Loma Mar have never been married, above 79% of cities.
Park access and Democratic lean
Places with heavy park coverage tend to lean Democratic; Loma Mar, CA sits in the top quarter nationally on this measure. Park access does not change how people vote; it tends to track denser, higher-income areas.
Why turnout in Loma Mar looks the way it does
Crowded housing lines up with lower turnout. About 6% of homes in Loma Mar have more than one occupant per room, above 91% of cities. Strong routine healthcare access lines up with higher turnout, and Loma Mar sits in the top quarter on routine-care measures. Learn more about the findings and methodology on the political spectrum map.
Nearby Cities
- Redwood Terrace, CA D+51
- Pescadero, CA D+34
- San Gregorio, CA D+36
- La Honda, CA D+54
- Sky Londa, CA D+48
- Portola Valley, CA D+58
- San Lorenzo Park, CA D+47
- Forest Springs, CA D+41
- Woodside, CA D+46
- Los Altos Hills, CA D+23
Cities with Similar Populations
- New Leipzig, ND R+69
- Elk Garden, VA R+70
- New Holland, IL R+58
- Orchard, CO R+68
- Byron, WI R+33
- Talma, IN R+61
- Mount Tabor, WI R+37
- Wooden Shoe Village, MI R+45
- Indian Town, VA R+38
- Figg, KY R+47
Sources and methodology
Precinct-level voting records used to fit the model come from California Secretary of State, Elections, distributed by the Voting and Election Science Team. Demographic inputs come from the U.S. Census Bureau (ACS 5-year estimates and the 2020 Decennial Census). Health and environmental inputs come from the CDC (PLACES and the Environmental Justice Index). Land cover comes from the USGS and EPA. Election-day and lead-up weather come from PRISM 4km daily grids and the NOAA Global Historical Climatology Network. Mail-voting and election-administration patterns come from the MIT Election Lab's Survey of the Performance of American Elections. Block-group crime detail comes from CrimeGrade. Internet data and modeling support provided by ISPreports.org.
Modeling and analysis by the BestNeighborhood data science team. Full methodology and findings: political spectrum map.
Methodology reviewed by the BestNeighborhood data team. Last updated May 2026.