Longbrook Estates is a Democratic stronghold. About 87% of voters here vote Democratic and 13% Republican.
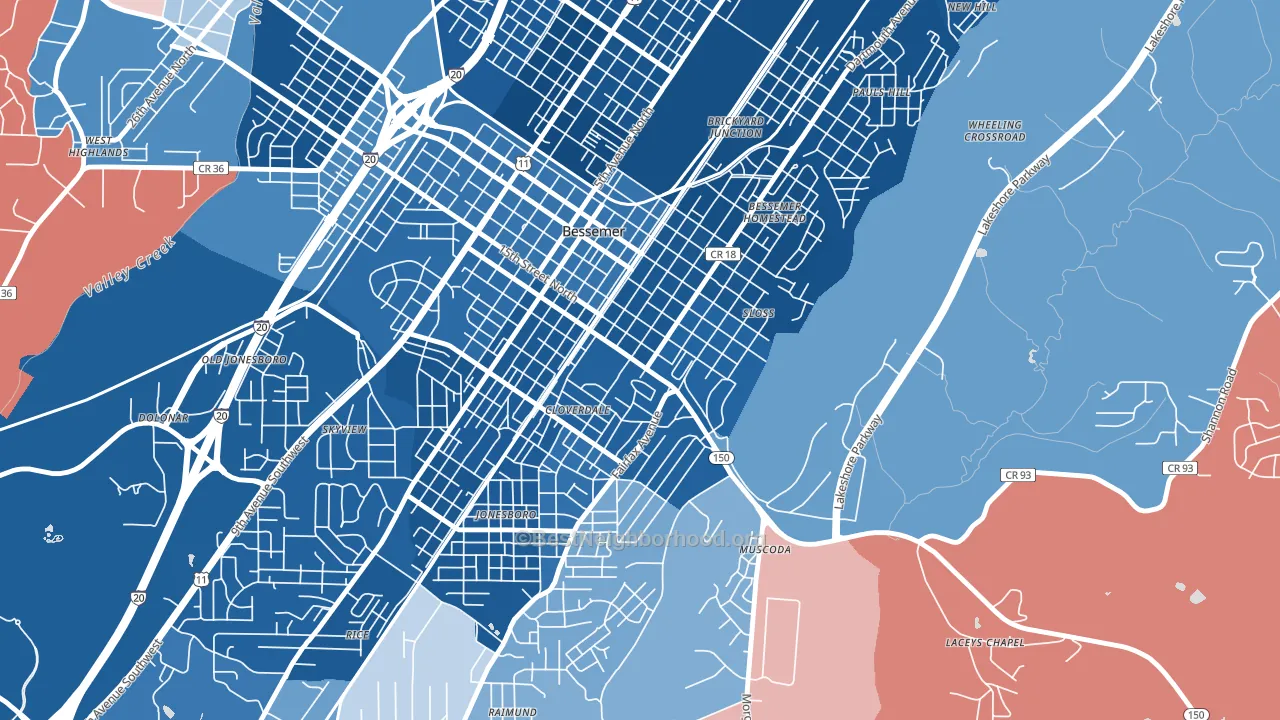
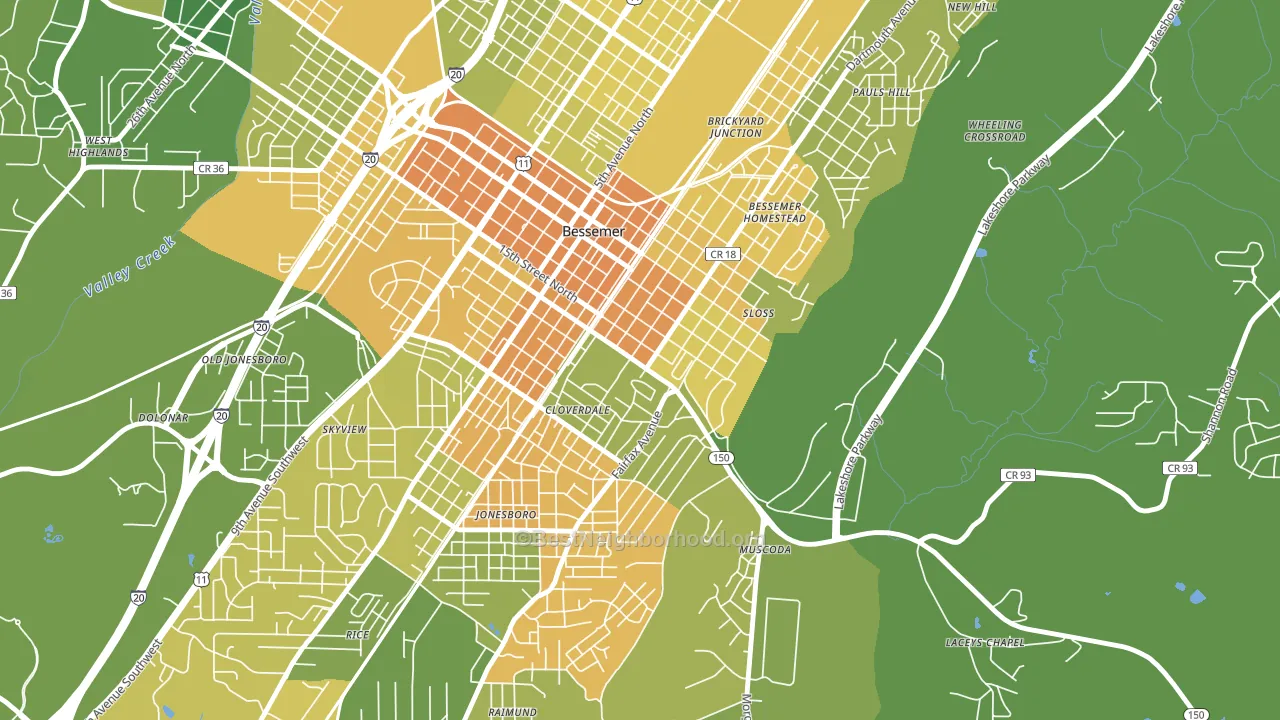
About 53% of adults in Longbrook Estates typically vote, below the U.S. average of about 62%. Among adults in Longbrook Estates, ~46% vote Democratic, ~7% Republican, and ~47% don't vote. The map below shows estimated turnout by block group.
How Longbrook Estates compares
Longbrook Estates runs about 105 points more Democratic than Alabama as a whole. Alabama leans Republican overall, while Longbrook Estates is one of the few Democratic-leaning pockets.
Politics vary noticeably by block within Longbrook Estates. The northeast side is the most Democratic-leaning (D+85) and the south side is the least Democratic-leaning (D+64), a spread of about 21 points.
Why Longbrook Estates leans the way it does
This analysis examined 14,881 data points per neighborhood to find what predicts political lean and turnout. The items below are a few correlations that stood out for Longbrook Estates, not a ranked or complete list of what matters most.
Longbrook Estates votes against the grain of Alabama. Alabama leans Republican overall, while Longbrook Estates runs about 105 points more Democratic. A high never-married share predicts Democratic voting, and about 47% of adults in Longbrook Estates have never been married, above 77% of neighborhoods.
High-school completion, uninsured rate, and voter turnout
Places that combine low high-school-completion share and a high uninsured rate tend to turn out at a lower rate, as Longbrook Estates, Bessemer, AL does.
Why turnout in Longbrook Estates looks the way it does
Areas with limited routine healthcare access turn out at lower rates. Longbrook Estates is in the bottom quarter nationally for routine-care measures such as insurance coverage, preventive screenings, and dental visits. The dental-visit rate here is about 40%, about 14 points below the Alabama average of 54%. High food insecurity lines up with lower turnout, and about 43% of adults in Longbrook Estates report food insecurity, above 96% of neighborhoods. Low high-school completion lines up with lower turnout, and about 84% of adults in Longbrook Estates have completed high school, below 79% of neighborhoods. Learn more about the findings and methodology on the political spectrum map.
Nearby Neighborhoods
- Belview Heights, Birmingham, AL D+90
- Riverchase Country Club, Hoover, AL R+31
- Crossgate, Vestavia Hills, AL R+4
- Arlington, Birmingham, AL D+90
- Glen Iris, Birmingham, AL D+56
- Five Points South, Birmingham, AL D+44
- Southside, Birmingham, AL D+42
- Redmont Park, Birmingham, AL R+10
- Highland Park, Birmingham, AL D+36
- Norwood, Birmingham, AL D+74
Neighborhoods with Similar Populations
- Frontenac, Aurora, IL D+26
- Riverside, Spokane, WA D+33
- Greenfield Courthouse Square Historic District, Greenfield, R+35
- Riviera-Westchester, Bakersfield, CA R+10
- West Rancho Domingues, Compton, CA D+61
- Denver Harbor-Port Houston, Houston, TX D+29
- Whipper Barnoy, North Charleston, SC D+74
- Washington Avenue-Memorial Park, Houston, TX D+23
- Saint Anthony, New Orleans, LA D+72
- Meadowood, Madison, WI D+62
Sources and methodology
Precinct-level voting records used to fit the model come from Alabama Secretary of State, Elections, distributed by the Voting and Election Science Team. Demographic inputs come from the U.S. Census Bureau (ACS 5-year estimates and the 2020 Decennial Census). Health and environmental inputs come from the CDC (PLACES and the Environmental Justice Index). Land cover comes from the USGS and EPA. Election-day and lead-up weather come from PRISM 4km daily grids and the NOAA Global Historical Climatology Network. Mail-voting and election-administration patterns come from the MIT Election Lab's Survey of the Performance of American Elections. Block-group crime detail comes from CrimeGrade. Internet data and modeling support provided by ISPreports.org.
Modeling and analysis by the BestNeighborhood data science team. Full methodology and findings: political spectrum map.
Methodology reviewed by the BestNeighborhood data team. Last updated May 2026.