Belview Heights is a Democratic stronghold. About 95% of voters here vote Democratic and 5% Republican.
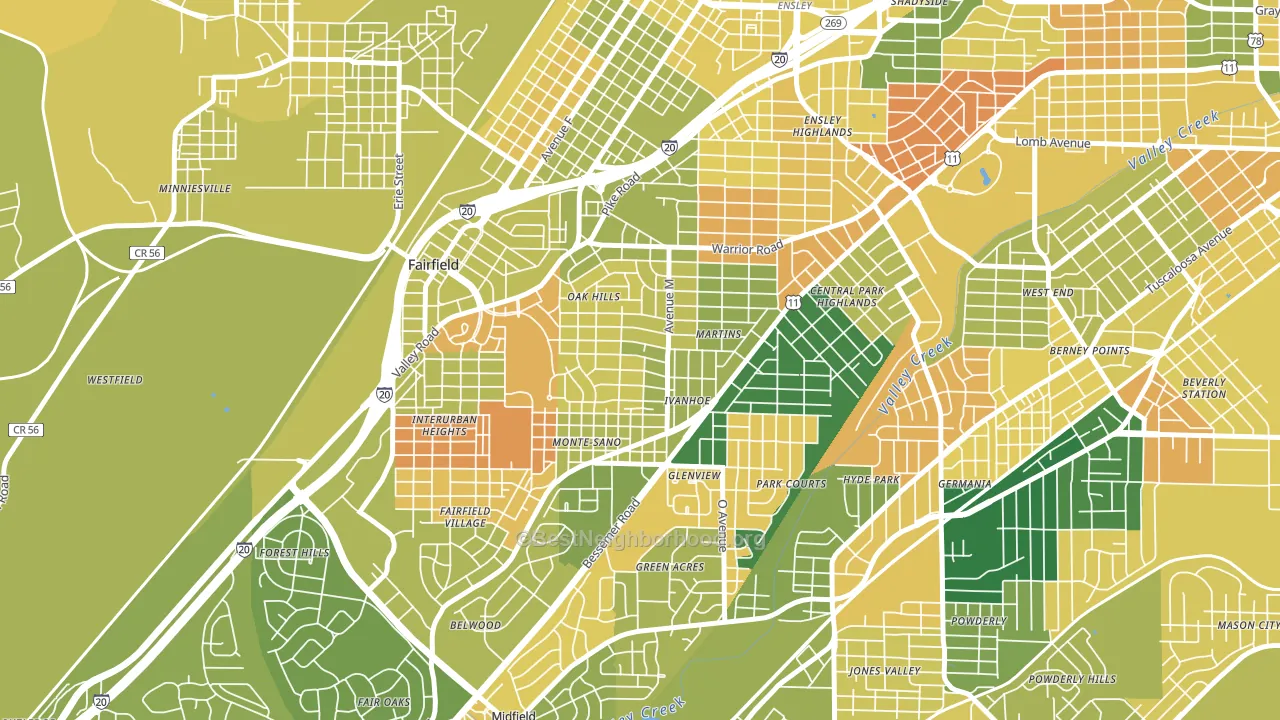
About 56% of adults in Belview Heights typically vote, below the U.S. average of about 62%. Among adults in Belview Heights, ~53% vote Democratic, ~3% Republican, and ~44% don't vote. The map below shows estimated turnout by block group.
How Belview Heights compares
Belview Heights sits in a sparsely populated area with few comparable neighborhoods nearby.
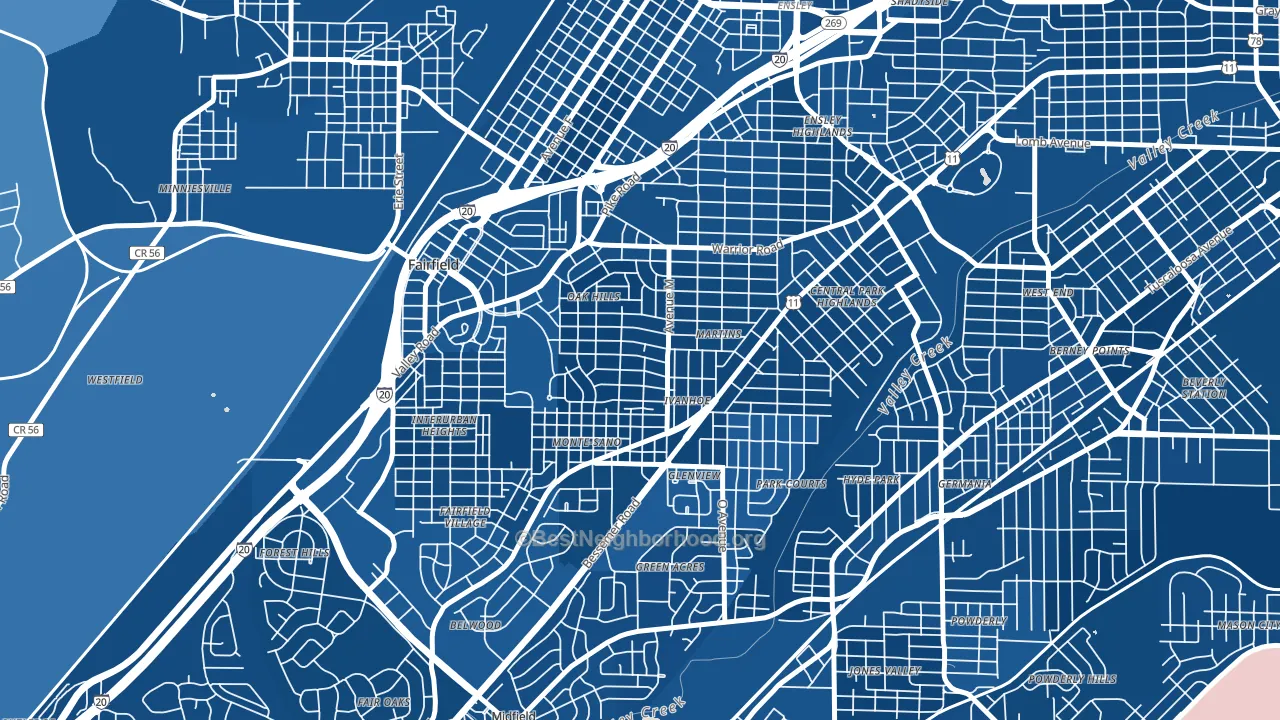
Belview Heights runs about 121 points more Democratic than Alabama as a whole. Alabama leans Republican overall, while Belview Heights is one of the few Democratic-leaning pockets.
Why Belview Heights leans the way it does
This analysis examined 14,881 data points per neighborhood to find what predicts political lean and turnout. The items below are a few correlations that stood out for Belview Heights, not a ranked or complete list of what matters most.
Density combined with diversity predicts Democratic voting. Non-Hispanic white share in Belview Heights is about 3%, about 69 points below the U.S. average of 72%. Belview Heights runs against the grain of Alabama, a Democratic-leaning pocket in a Republican-leaning state.
Preventive-care access and voter turnout
Places with limited routine preventive-care access tend to turn out at a lower rate; Belview Heights, Birmingham, AL sits in the bottom quarter nationally on this measure. Dental visits do not drive turnout; the rate reflects income, insurance, and healthcare access, which line up with who votes.
Why turnout in Belview Heights looks the way it does
Areas with high food insecurity turn out at lower rates. About 37% of adults in Belview Heights report food insecurity, about 21 points above the U.S. average of 16%. Strong routine healthcare access lines up with higher turnout, and Belview Heights sits in the top quarter on routine-care measures. Learn more about the findings and methodology on the political spectrum map.
Nearby Neighborhoods
- Arlington, Birmingham, AL D+90
- Glen Iris, Birmingham, AL D+56
- Five Points South, Birmingham, AL D+44
- Southside, Birmingham, AL D+42
- Norwood, Birmingham, AL D+74
- Crossgate, Vestavia Hills, AL R+4
- Highland Park, Birmingham, AL D+36
- Longbrook Estates, Bessemer, AL D+75
- Redmont Park, Birmingham, AL R+10
- Forest Park, Birmingham, AL D+28
Neighborhoods with Similar Populations
- Shockoe Bottom, Richmond, VA D+65
- Claremont Cottages, Chicago, IL D+71
- Bel Aire, Wheat Ridge, CO D+23
- Downtown, Prosser, WA R+20
- McClure Park, Tulsa, OK D+3
- Terrell Wells, San Antonio, TX D+22
- Central Brambleton, Norfolk, VA D+84
- Greens of McKinney, McKinney, TX R+2
- Crossroads-Riverbank, Riverbank, CA R+19
- Craig Farms, Port Orange, FL R+31
Sources and methodology
Precinct-level voting records used to fit the model come from Alabama Secretary of State, Elections, distributed by the Voting and Election Science Team. Demographic inputs come from the U.S. Census Bureau (ACS 5-year estimates and the 2020 Decennial Census). Health and environmental inputs come from the CDC (PLACES and the Environmental Justice Index). Land cover comes from the USGS and EPA. Election-day and lead-up weather come from PRISM 4km daily grids and the NOAA Global Historical Climatology Network. Mail-voting and election-administration patterns come from the MIT Election Lab's Survey of the Performance of American Elections. Block-group crime detail comes from CrimeGrade. Internet data and modeling support provided by ISPreports.org.
Modeling and analysis by the BestNeighborhood data science team. Full methodology and findings: political spectrum map.
Methodology reviewed by the BestNeighborhood data team. Last updated May 2026.