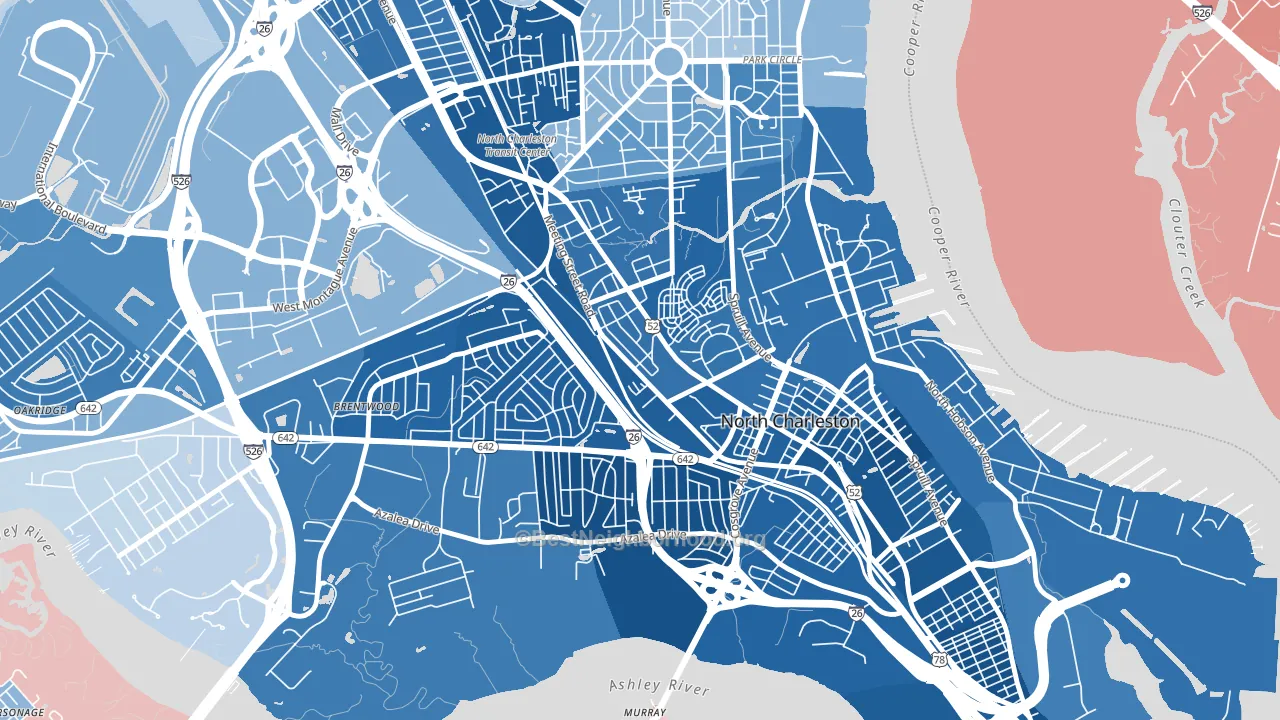
Whipper Barnoy is a Democratic stronghold. About 87% of voters here vote Democratic and 13% Republican.
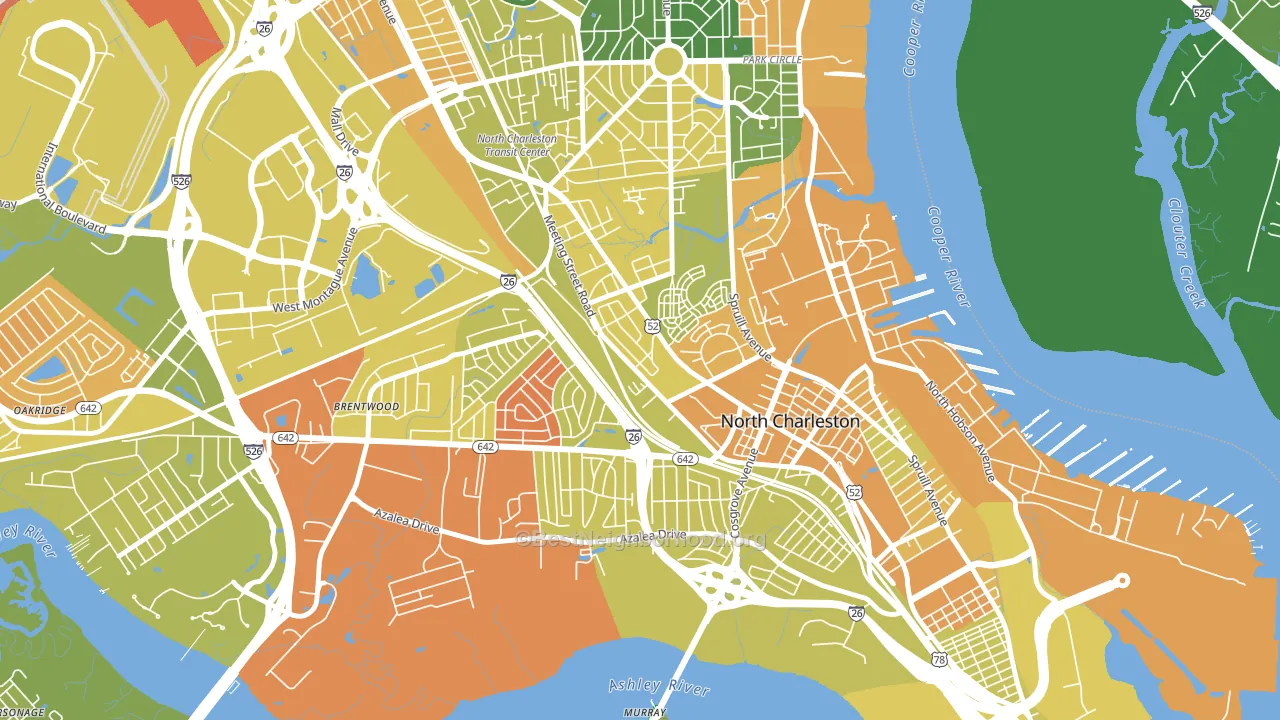
About 48% of adults in Whipper Barnoy typically vote, below the U.S. average of about 62%. Among adults in Whipper Barnoy, ~42% vote Democratic, ~6% Republican, and ~52% don't vote. The map below shows estimated turnout by block group.
How Whipper Barnoy compares
Whipper Barnoy runs about 91 points more Democratic than South Carolina as a whole. South Carolina leans Republican overall, while Whipper Barnoy is one of the few Democratic-leaning pockets.
Politics vary noticeably by block within Whipper Barnoy. The southeast side is the most Democratic-leaning (D+81) and the northwest side is the least Democratic-leaning (D+66), a spread of about 16 points.
Why Whipper Barnoy leans the way it does
This analysis examined 14,881 data points per neighborhood to find what predicts political lean and turnout. The items below are a few correlations that stood out for Whipper Barnoy, not a ranked or complete list of what matters most.
Whipper Barnoy votes against the grain of South Carolina. South Carolina leans Republican overall, while Whipper Barnoy runs about 91 points more Democratic. A high never-married share predicts Democratic voting, and about 47% of adults in Whipper Barnoy have never been married, above 77% of neighborhoods.
Food insecurity and voter turnout
Places with high food insecurity tend to turn out at a lower rate; Whipper Barnoy, North Charleston, SC sits in the top quarter nationally on this measure. Food insecurity does not directly drive turnout; it reflects economic hardship, which lines up with lower voting.
Why turnout in Whipper Barnoy looks the way it does
Areas with limited routine healthcare access turn out at lower rates. Whipper Barnoy is in the bottom quarter nationally for routine-care measures such as insurance coverage, preventive screenings, and dental visits. The dental-visit rate here is about 49%, about 10 points below the South Carolina average of 58%. Renters vote less often than owners, and about 66% of households in Whipper Barnoy rent, compared to around 46% in nearby neighborhoods. High food insecurity lines up with lower turnout, and about 34% of adults in Whipper Barnoy report food insecurity, above 88% of neighborhoods. Learn more about the findings and methodology on the political spectrum map.
Nearby Neighborhoods
- Daniel Island, Charleston, SC R+21
- Charleston Historic District, Charleston, SC D+12
- Boltons Landing, Charleston, SC D+7
- College Park, Ladson, SC R+5
- White Gables, Summerville, SC R+27
- Midtown Savannah, Savannah, GA D+71
- Ardmore-Gould Estates-Olin Heights, Savannah, GA D+36
- Chatham Parkway, Savannah, GA D+42
- Hunter Army Airfield, Savannah, GA D+4
- Paradise Park, Savannah, GA D+29
Neighborhoods with Similar Populations
- Washington Avenue-Memorial Park, Houston, TX D+23
- Denver Harbor-Port Houston, Houston, TX D+29
- Saint Anthony, New Orleans, LA D+72
- Riviera-Westchester, Bakersfield, CA R+10
- Meadowood, Madison, WI D+62
- Frontenac, Aurora, IL D+26
- Longbrook Estates, Bessemer, AL D+75
- Avalon Park Northwest Village, Alafaya, FL D+5
- Sonoma Ranch, Helotes, TX R+4
- Riverside, Spokane, WA D+33
Sources and methodology
Precinct-level voting records used to fit the model come from South Carolina State Election Commission, distributed by the Voting and Election Science Team. Demographic inputs come from the U.S. Census Bureau (ACS 5-year estimates and the 2020 Decennial Census). Health and environmental inputs come from the CDC (PLACES and the Environmental Justice Index). Land cover comes from the USGS and EPA. Election-day and lead-up weather come from PRISM 4km daily grids and the NOAA Global Historical Climatology Network. Mail-voting and election-administration patterns come from the MIT Election Lab's Survey of the Performance of American Elections. Block-group crime detail comes from CrimeGrade. Internet data and modeling support provided by ISPreports.org.
Modeling and analysis by the BestNeighborhood data science team. Full methodology and findings: political spectrum map.
Methodology reviewed by the BestNeighborhood data team. Last updated May 2026.