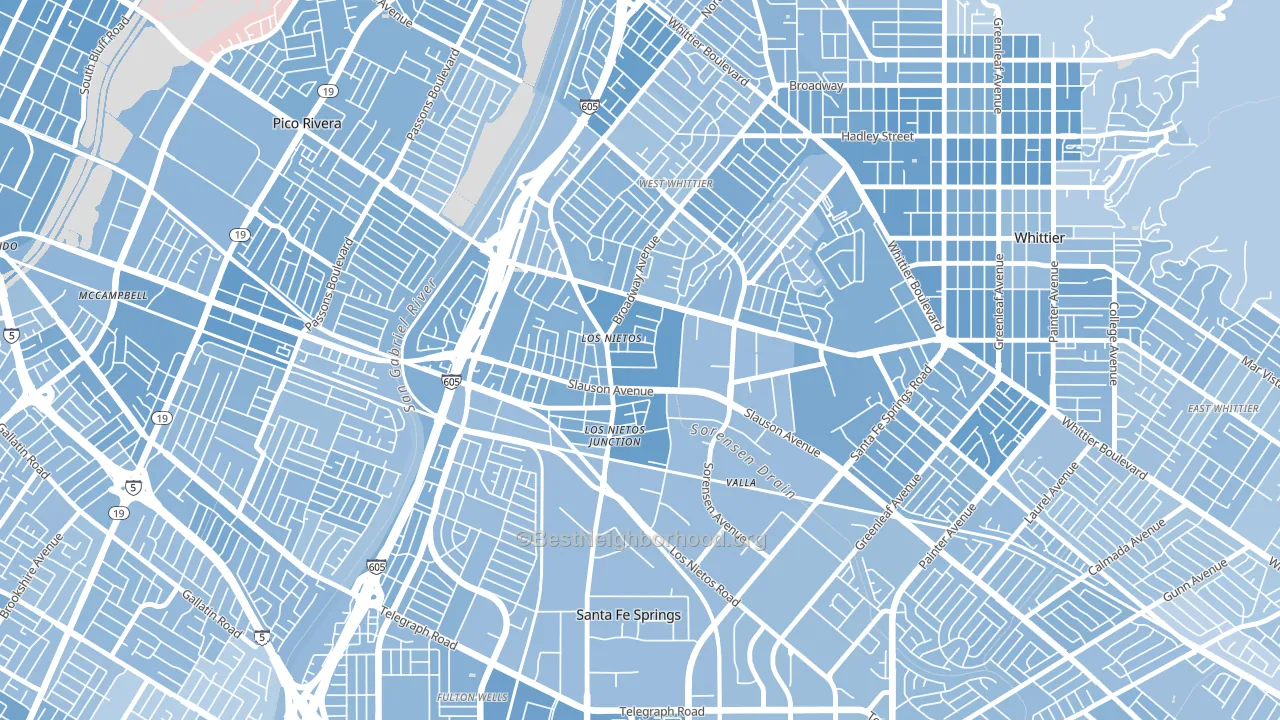
Los Neitos leans Democratic by roughly 28 points: about 64% of voters vote Democratic and 36% Republican.
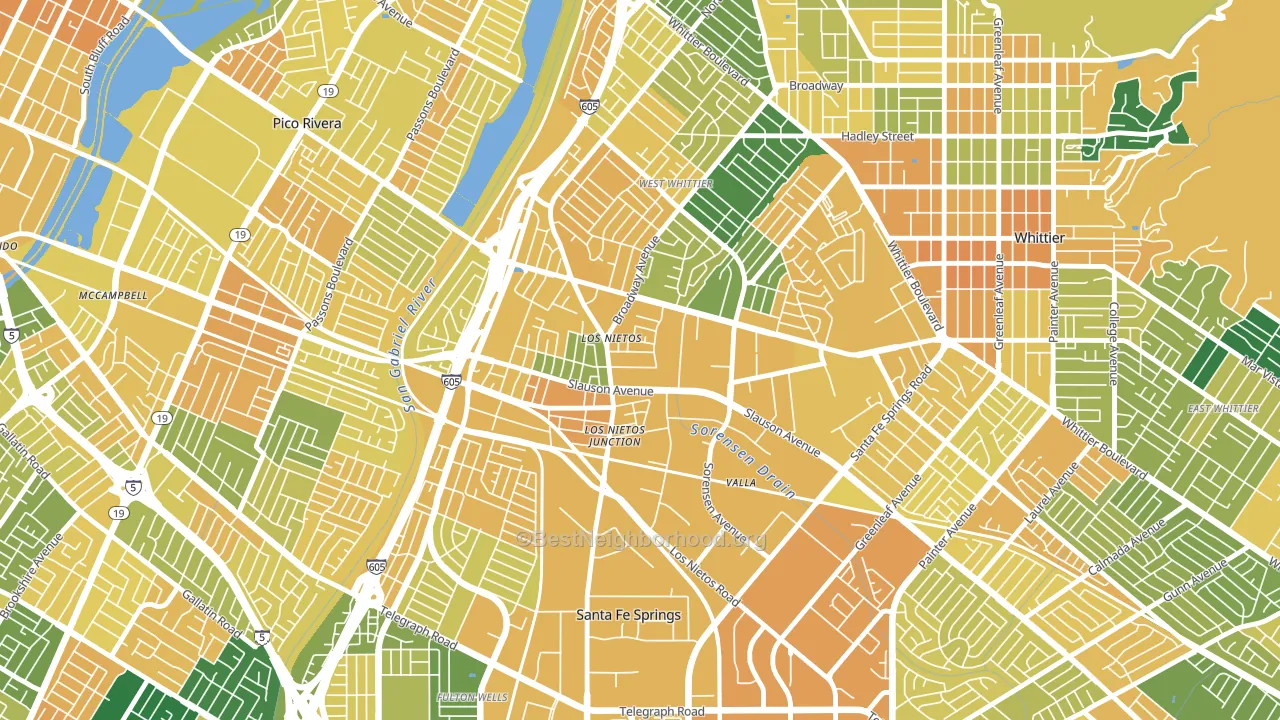
About 45% of adults in Los Neitos typically vote, below the U.S. average of about 62%. Among adults in Los Neitos, ~29% vote Democratic, ~16% Republican, and ~55% don't vote. The map below shows estimated turnout by block group.
How Los Neitos compares
Los Neitos sits in a sparsely populated area with few comparable neighborhoods nearby.
Los Neitos runs about 7 points more Democratic than California as a whole.
Why Los Neitos leans the way it does
This analysis examined 14,881 data points per neighborhood to find what predicts political lean and turnout. The items below are a few correlations that stood out for Los Neitos, not a ranked or complete list of what matters most.
Dense areas vote Democratic. More than 99% of residents in Los Neitos live in densely developed areas, about 64 points above the U.S. average of 36%.
Walkability and Democratic lean
Places with a highly walkable street grid tend to lean Democratic; Los Neitos, West Whittier-Los Nietos, CA sits in the top quarter nationally on this measure. A walkable street grid does not change how people vote; it mostly reflects how urban a place is.
Why turnout in Los Neitos looks the way it does
Areas with limited routine healthcare access turn out at lower rates. Los Neitos is in the bottom quarter nationally for routine-care measures such as insurance coverage, preventive screenings, and dental visits. Crowded housing lines up with lower turnout, and about 16% of homes in Los Neitos have more than one occupant per room, above 97% of neighborhoods. Low high-school completion lines up with lower turnout, and about 72% of adults in Los Neitos have completed high school, below 93% of neighborhoods. Learn more about the findings and methodology on the political spectrum map.
Nearby Neighborhoods
- El Rancho, Pico Rivera, CA D+29
- Little Lake City, Santa Fe Springs, CA D+24
- Valle Lindo, South El Monte, CA D+25
- South San Gabriel, Rosemead, CA D+24
- Lowell, La Habra, CA Even
- Bandini, Commerce, CA D+37
- Walker, Maywood, CA D+39
- Hollydale, South Gate, CA D+31
- Garvey, Rosemead, CA D+17
- Mountain View, El Monte, CA D+28
Neighborhoods with Similar Populations
- North Central Westminster, Westminster, CO D+22
- University Heights, Newark, NJ D+67
- Cully, Portland, OR D+63
- Tule Springs, Las Vegas, NV R+13
- Au-Tenleytown, Washington, DC D+66
- Bario Logan, San Diego, CA D+39
- Chinquapin Park-Belvedere, Baltimore, MD D+73
- South Boston, Boston, MA D+48
- Northwest Colorado Springs, Colorado Springs, CO Even
- Beverly, Chicago, IL D+50
Sources and methodology
Precinct-level voting records used to fit the model come from California Secretary of State, Elections, distributed by the Voting and Election Science Team. Demographic inputs come from the U.S. Census Bureau (ACS 5-year estimates and the 2020 Decennial Census). Health and environmental inputs come from the CDC (PLACES and the Environmental Justice Index). Land cover comes from the USGS and EPA. Election-day and lead-up weather come from PRISM 4km daily grids and the NOAA Global Historical Climatology Network. Mail-voting and election-administration patterns come from the MIT Election Lab's Survey of the Performance of American Elections. Block-group crime detail comes from CrimeGrade. Internet data and modeling support provided by ISPreports.org.
Modeling and analysis by the BestNeighborhood data science team. Full methodology and findings: political spectrum map.
Methodology reviewed by the BestNeighborhood data team. Last updated May 2026.