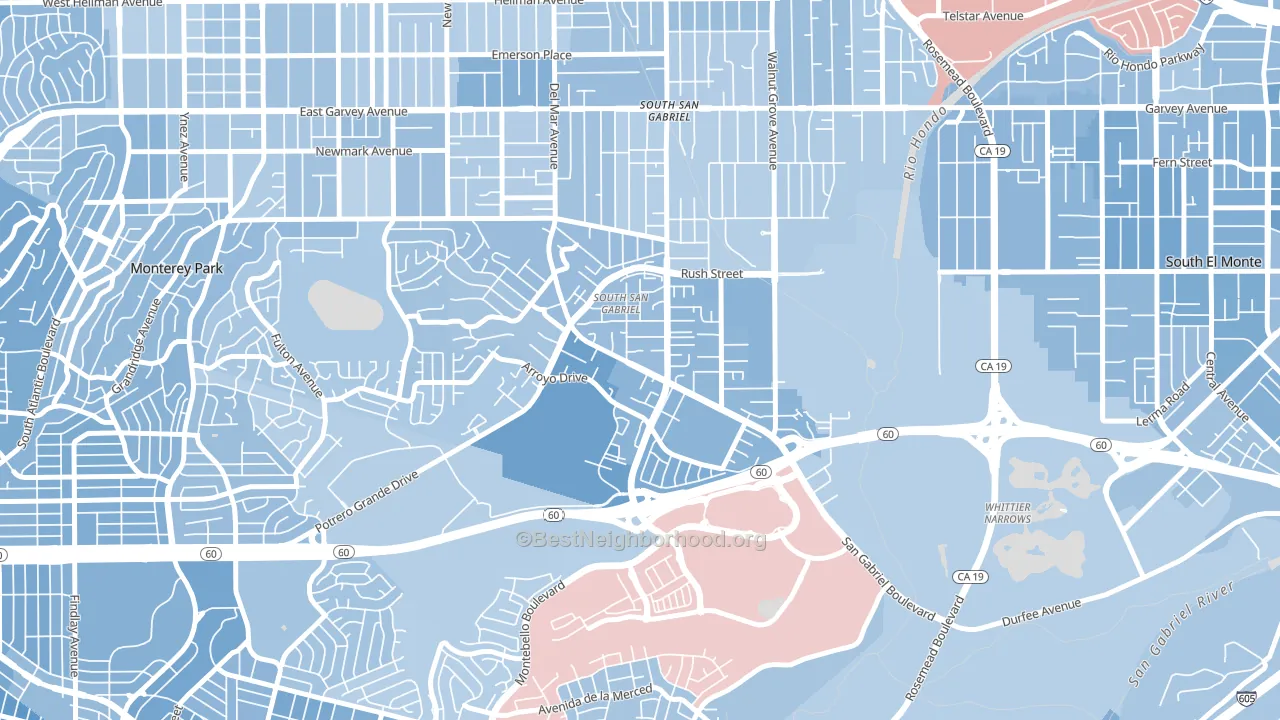
South San Gabriel leans Democratic by roughly 24 points: about 62% of voters vote Democratic and 38% Republican.
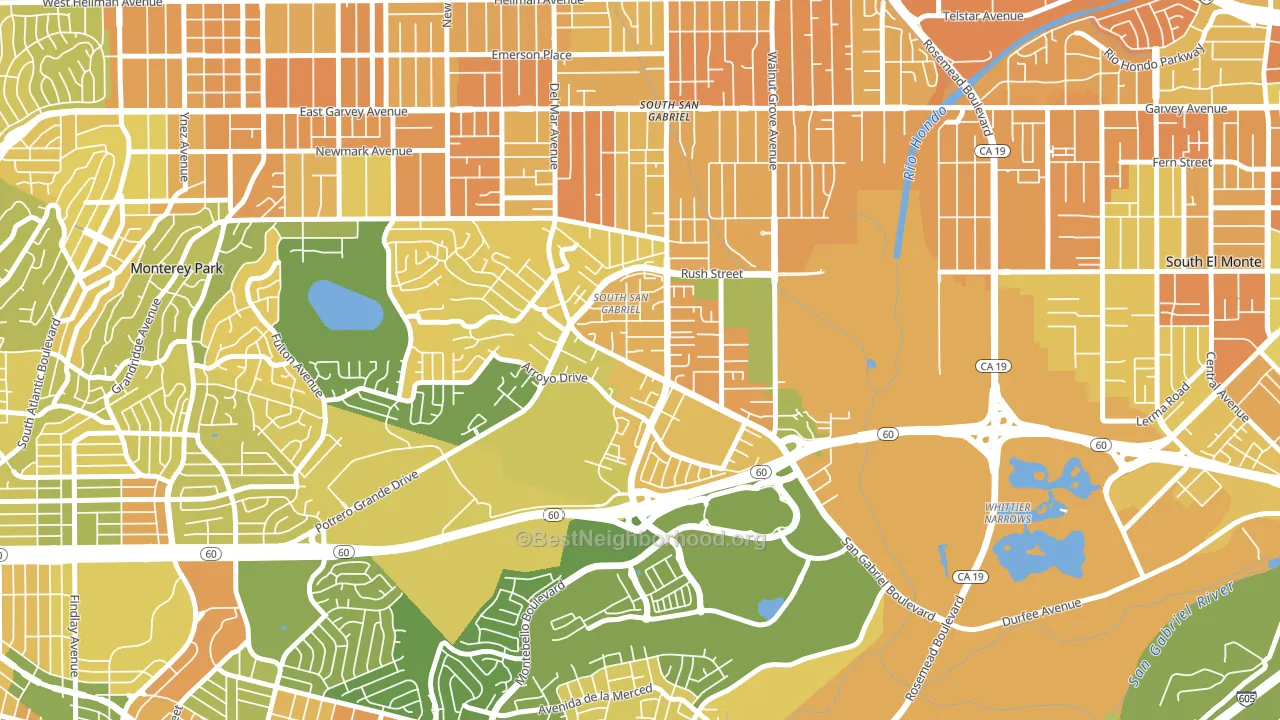
About 43% of adults in South San Gabriel typically vote, below the U.S. average of about 62%. Among adults in South San Gabriel, ~27% vote Democratic, ~16% Republican, and ~57% don't vote. The map below shows estimated turnout by block group.
How South San Gabriel compares
Among neighborhoods within 5 miles, South San Gabriel leans more Democratic than 1 of 5 neighbors.
Politically, South San Gabriel sits close to the rest of California.
Politics vary noticeably by block within South San Gabriel. The northeast side is the most Democratic-leaning (D+34) and the northwest side is the least Democratic-leaning (D+19), a spread of about 15 points.
Why South San Gabriel leans the way it does
This analysis examined 14,881 data points per neighborhood to find what predicts political lean and turnout. The items below are a few correlations that stood out for South San Gabriel, not a ranked or complete list of what matters most.
Dense areas vote Democratic. More than 99% of residents in South San Gabriel live in densely developed areas, about 64 points above the U.S. average of 36%.
Cancer-screening access and voter turnout
Places with low colon-cancer-screening access tend to turn out at a lower rate; South San Gabriel, Rosemead, CA sits in the bottom tenth nationally on this measure. Cancer screening does not drive turnout; it reflects income, insurance, and healthcare access.
Why turnout in South San Gabriel looks the way it does
Crowded housing lines up with lower turnout. About 13% of homes in South San Gabriel have more than one occupant per room, above 94% of neighborhoods. Learn more about the findings and methodology on the political spectrum map.
Nearby Neighborhoods
- Garvey, Rosemead, CA D+17
- Valle Lindo, South El Monte, CA D+25
- El Rancho, Pico Rivera, CA D+29
- Mountain View, El Monte, CA D+28
- Bandini, Commerce, CA D+37
- East San Gabriel, San Gabriel, CA D+20
- North El Monte, Arcadia, CA D+13
- El Sereno, Los Angeles, CA D+43
- Los Neitos, West Whittier-Los Nietos, CA D+27
- Bassett, West Puente Valley, CA D+31
Neighborhoods with Similar Populations
- Kranz Woods, Detroit, MI D+87
- Collins Gardens, San Antonio, TX D+36
- Starmount Forest, Greensboro, NC D+39
- Americana, Oak Ridge, FL D+57
- Lookout Valley, Chattanooga, TN R+38
- Ventura, San Antonio, TX D+22
- Candlewood Park, San Antonio, TX D+29
- Hampton Cove, Owens Cross Roads, AL R+37
- South Fountain Avenue Historic District, Springfield, OH D+40
- North, Helena, MT R+3
Sources and methodology
Precinct-level voting records used to fit the model come from California Secretary of State, Elections, distributed by the Voting and Election Science Team. Demographic inputs come from the U.S. Census Bureau (ACS 5-year estimates and the 2020 Decennial Census). Health and environmental inputs come from the CDC (PLACES and the Environmental Justice Index). Land cover comes from the USGS and EPA. Election-day and lead-up weather come from PRISM 4km daily grids and the NOAA Global Historical Climatology Network. Mail-voting and election-administration patterns come from the MIT Election Lab's Survey of the Performance of American Elections. Block-group crime detail comes from CrimeGrade. Internet data and modeling support provided by ISPreports.org.
Modeling and analysis by the BestNeighborhood data science team. Full methodology and findings: political spectrum map.
Methodology reviewed by the BestNeighborhood data team. Last updated May 2026.