Marina Lagoon leans heavily Democratic by roughly 50 points: about 75% of voters vote Democratic and 25% Republican.
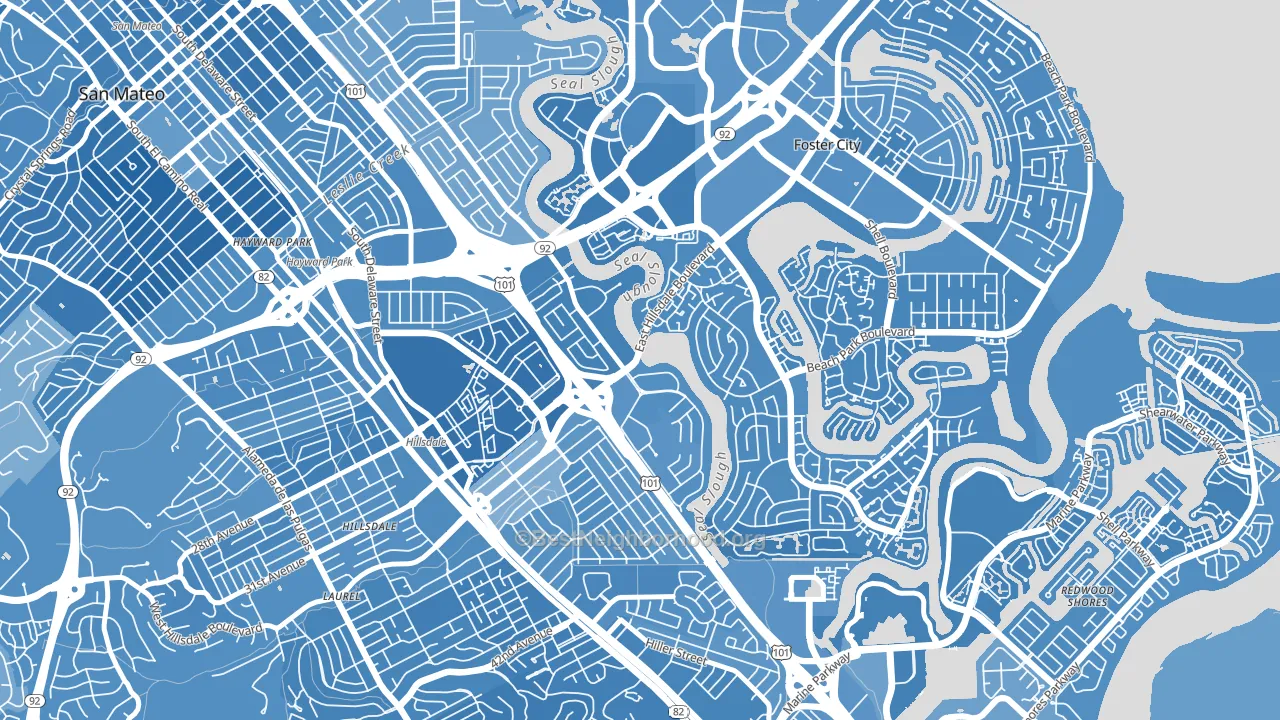
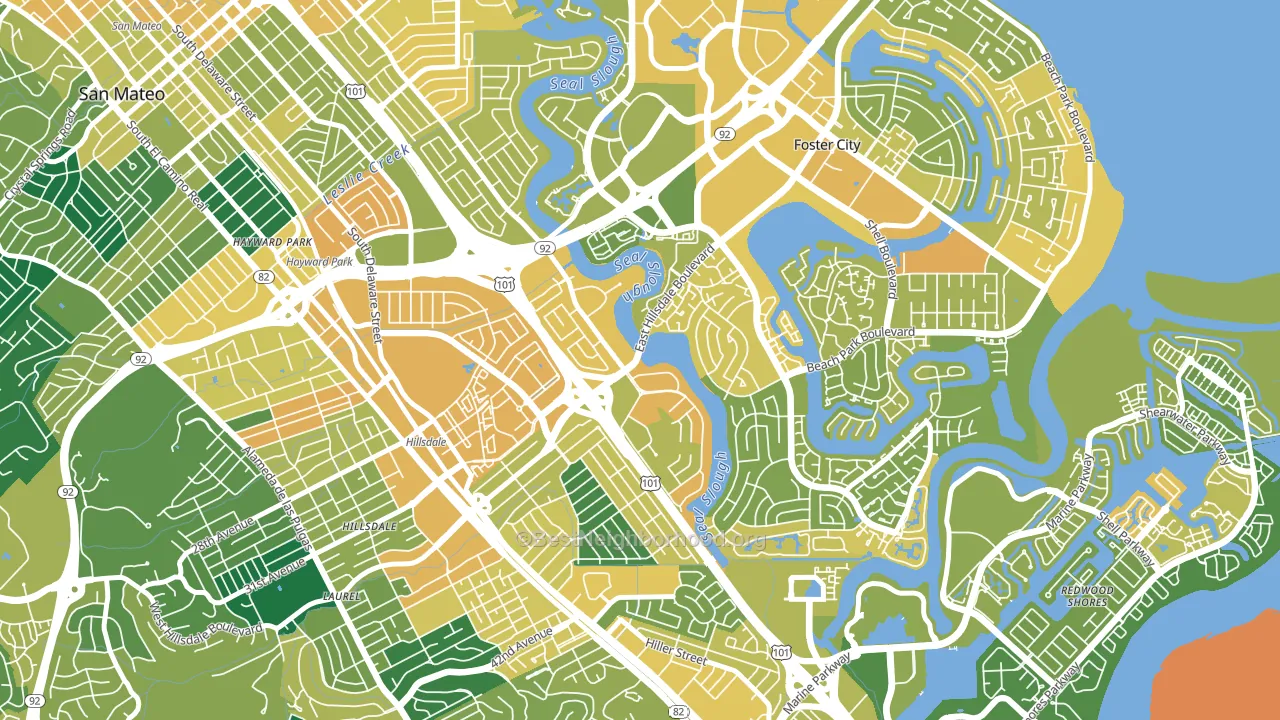
About 56% of adults in Marina Lagoon typically vote, below the U.S. average of about 62%. Among adults in Marina Lagoon, ~42% vote Democratic, ~14% Republican, and ~44% don't vote. The map below shows estimated turnout by block group.
How Marina Lagoon compares
Among neighborhoods within 5 miles, Marina Lagoon leans more Democratic than 3 of 12 neighbors.
Marina Lagoon runs about 30 points more Democratic than California as a whole.
Why Marina Lagoon leans the way it does
This analysis examined 14,881 data points per neighborhood to find what predicts political lean and turnout. The items below are a few correlations that stood out for Marina Lagoon, not a ranked or complete list of what matters most.
Areas with high college attainment vote Democratic. About 59% of adults in Marina Lagoon hold a bachelor's degree, about 31 points above the U.S. average of 28%.
Paved land cover and Democratic lean
Places with extensive paved surfaces tend to lean Democratic; Marina Lagoon, San Mateo, CA sits above the national average on this measure. Paved ground does not change how people vote; it mostly reflects how urban and built-up a place is.
Why turnout in Marina Lagoon looks the way it does
Crowded housing lines up with lower turnout. About 11% of homes in Marina Lagoon have more than one occupant per room, above 93% of neighborhoods. Strong routine healthcare access lines up with higher turnout, and Marina Lagoon sits in the top quarter on routine-care measures. Renters vote less often than owners, and about 70% of households in Marina Lagoon rent, compared to around 45% in nearby neighborhoods. Learn more about the findings and methodology on the political spectrum map.
Nearby Neighborhoods
- Hillsdale, San Mateo, CA D+50
- Haywood Park, San Mateo, CA D+52
- Beresford, San Mateo, CA D+52
- Shoreview, San Mateo, CA D+44
- East San Mateo, San Mateo, CA D+40
- Sugerloaf, San Mateo, CA D+50
- Downtown San Mateo, San Mateo, CA D+55
- Baywood-Aragon, San Mateo, CA D+51
- Western Hills, San Mateo, CA D+41
- North Central San Francisco, San Mateo, CA D+50
Neighborhoods with Similar Populations
- Downtown Jacinto City, Jacinto City, TX D+9
- Straw-Smyth, Manchester, NH D+32
- Timberwood Park, San Antonio, TX R+26
- Downtown Annapolis, Annapolis, MD D+46
- Bonneville, Orem, UT R+25
- Washington Heights, Milwaukee, WI D+62
- Imperial Point, Fort Lauderdale, FL R+5
- Vine City, Atlanta, GA D+78
- Haynes Area, Nashville, TN D+81
- Arlington Ridge, Arlington, VA D+60
Sources and methodology
Precinct-level voting records used to fit the model come from California Secretary of State, Elections, distributed by the Voting and Election Science Team. Demographic inputs come from the U.S. Census Bureau (ACS 5-year estimates and the 2020 Decennial Census). Health and environmental inputs come from the CDC (PLACES and the Environmental Justice Index). Land cover comes from the USGS and EPA. Election-day and lead-up weather come from PRISM 4km daily grids and the NOAA Global Historical Climatology Network. Mail-voting and election-administration patterns come from the MIT Election Lab's Survey of the Performance of American Elections. Block-group crime detail comes from CrimeGrade. Internet data and modeling support provided by ISPreports.org.
Modeling and analysis by the BestNeighborhood data science team. Full methodology and findings: political spectrum map.
Methodology reviewed by the BestNeighborhood data team. Last updated May 2026.