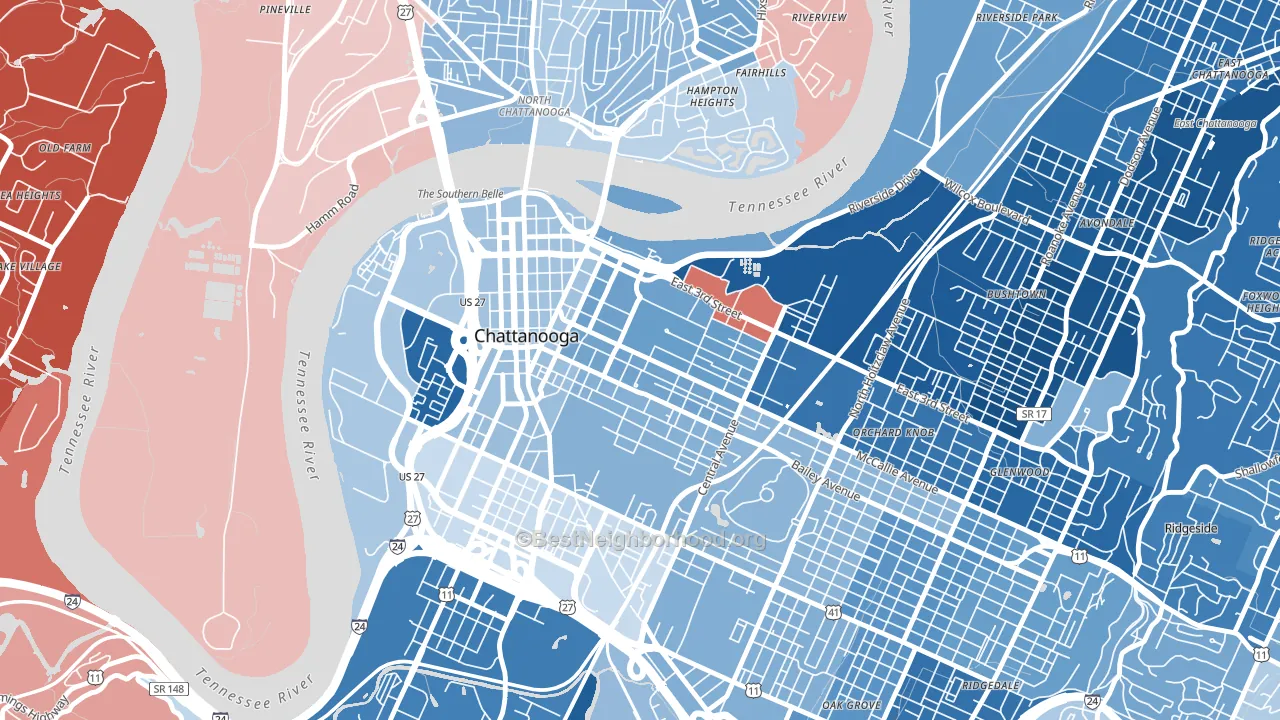
Martin Luther King leans heavily Democratic by roughly 36 points: about 68% of voters vote Democratic and 32% Republican.
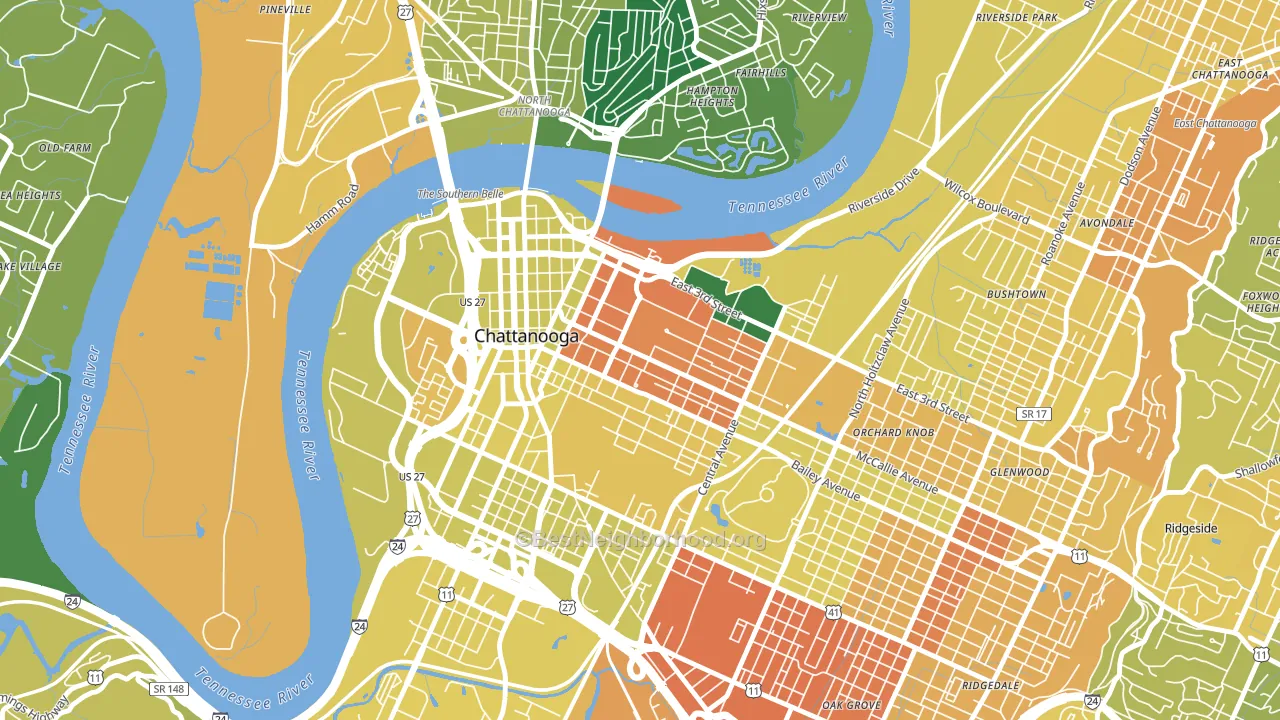
About 30% of adults in Martin Luther King typically vote, below the U.S. average of about 62%. Among adults in Martin Luther King, ~20% vote Democratic, ~10% Republican, and ~70% don't vote. The map below shows estimated turnout by block group.
How Martin Luther King compares
Among neighborhoods within 5 miles, Martin Luther King leans more Democratic than 2 of 4 neighbors.
Martin Luther King runs about 66 points more Democratic than Tennessee as a whole. Tennessee leans Republican overall, while Martin Luther King is one of the few Democratic-leaning pockets.
Politics vary noticeably by block within Martin Luther King. The east side is the most Democratic-leaning (D+43) and the south side is the least Democratic-leaning (D+31), a spread of about 12 points.
Why Martin Luther King leans the way it does
This analysis examined 14,881 data points per neighborhood to find what predicts political lean and turnout. The items below are a few correlations that stood out for Martin Luther King, not a ranked or complete list of what matters most.
Martin Luther King votes against the grain of Tennessee. Tennessee leans Republican overall, while Martin Luther King runs about 66 points more Democratic. High college attainment predicts Democratic voting, and Martin Luther King sits in the top quarter (about 58%, above 78% of neighborhoods). A high never-married share predicts Democratic voting, and about 84% of adults in Martin Luther King have never been married, in the top fraction of neighborhoods.
Walkability and Democratic lean
Places with a highly walkable street grid tend to lean Democratic; Martin Luther King, Chattanooga, TN sits in the top quarter nationally on this measure. A walkable street grid does not change how people vote; it mostly reflects how urban a place is.
Why turnout in Martin Luther King looks the way it does
Renters vote less often than owners. About 73% of households in Martin Luther King rent, about 48 points above the U.S. average of 25%. High-crime urban areas turn out at lower rates, and Martin Luther King sits in the top 15% on a violent-crime measure. Learn more about the findings and methodology on the political spectrum map.
Nearby Neighborhoods
- Downtown Chattanooga, Chattanooga, TN D+40
- Highland Park, Chattanooga, TN D+42
- Northside Community, Chattanooga, TN D+17
- Lookout Valley, Chattanooga, TN R+38
- Cannon Heights, Dalton, GA D+4
- Hampton Cove, Owens Cross Roads, AL R+37
- Downtown Huntsville, Huntsville, AL D+8
- Brookwood, Acworth, GA Even
- Crabapple, Milton, GA R+6
- Trowbridge Square, Sandy Springs, GA D+62
Neighborhoods with Similar Populations
- Cherrydale, Arlington, VA D+57
- Sugar Pond Manor of Wellington, Wellington, FL R+6
- Lakewide, Oakland, CA D+75
- US Navy Little Creek Amphibious Base, Norfolk, VA D+7
- Victory Hills, Albuquerque, NM D+51
- Heart of Missoula, Missoula, MT D+51
- West Gate, Austin, TX D+48
- Wyatt Street, Largo, FL D+8
- University Medical Center, Las Vegas, NV D+31
- Southside University, St. Cloud, MN D+29
Sources and methodology
Precinct-level voting records used to fit the model come from Tennessee Secretary of State, Division of Elections, distributed by the Voting and Election Science Team. Demographic inputs come from the U.S. Census Bureau (ACS 5-year estimates and the 2020 Decennial Census). Health and environmental inputs come from the CDC (PLACES and the Environmental Justice Index). Land cover comes from the USGS and EPA. Election-day and lead-up weather come from PRISM 4km daily grids and the NOAA Global Historical Climatology Network. Mail-voting and election-administration patterns come from the MIT Election Lab's Survey of the Performance of American Elections. Block-group crime detail comes from CrimeGrade. Internet data and modeling support provided by ISPreports.org.
Modeling and analysis by the BestNeighborhood data science team. Full methodology and findings: political spectrum map.
Methodology reviewed by the BestNeighborhood data team. Last updated May 2026.