Milneburg is a Democratic stronghold. About 89% of voters here vote Democratic and 11% Republican.
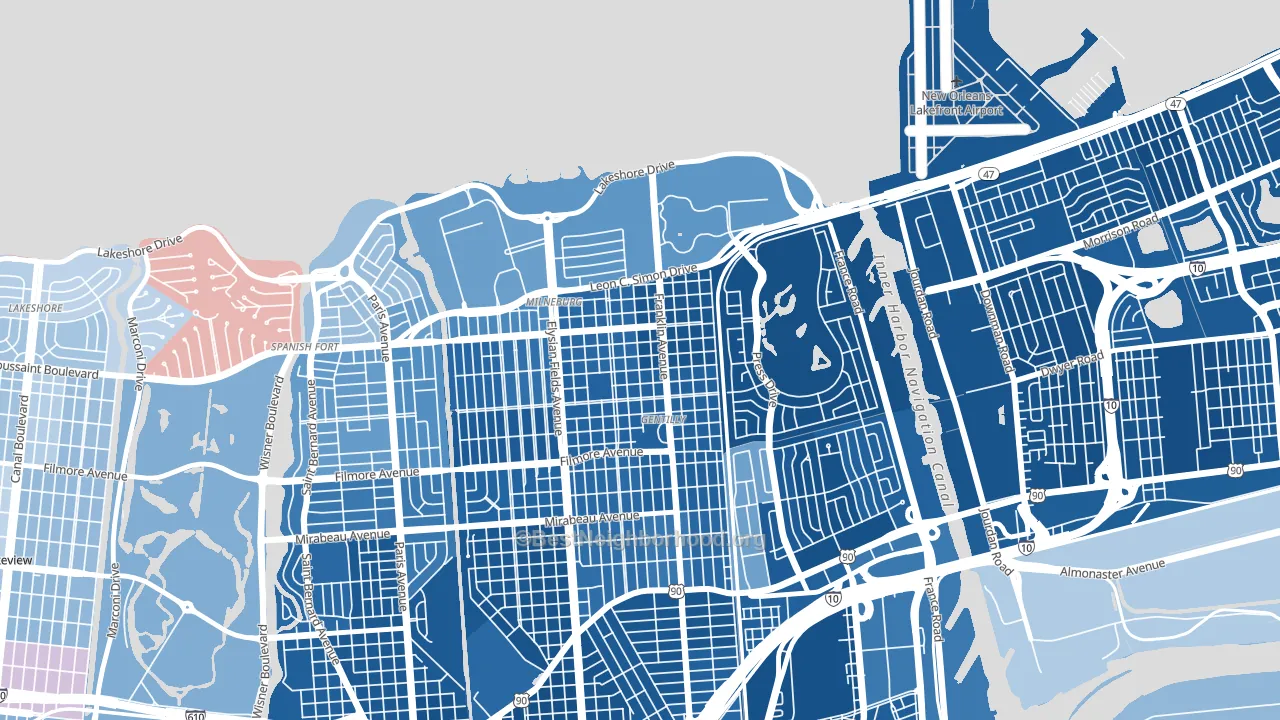
About 56% of adults in Milneburg typically vote, below the U.S. average of about 62%. Among adults in Milneburg, ~50% vote Democratic, ~6% Republican, and ~44% don't vote. The map below shows estimated turnout by block group.
How Milneburg compares
Among neighborhoods within 5 miles, Milneburg leans more Democratic than 19 of 28 neighbors.
Milneburg runs about 99 points more Democratic than Louisiana as a whole. Louisiana leans Republican overall, while Milneburg is one of the few Democratic-leaning pockets.
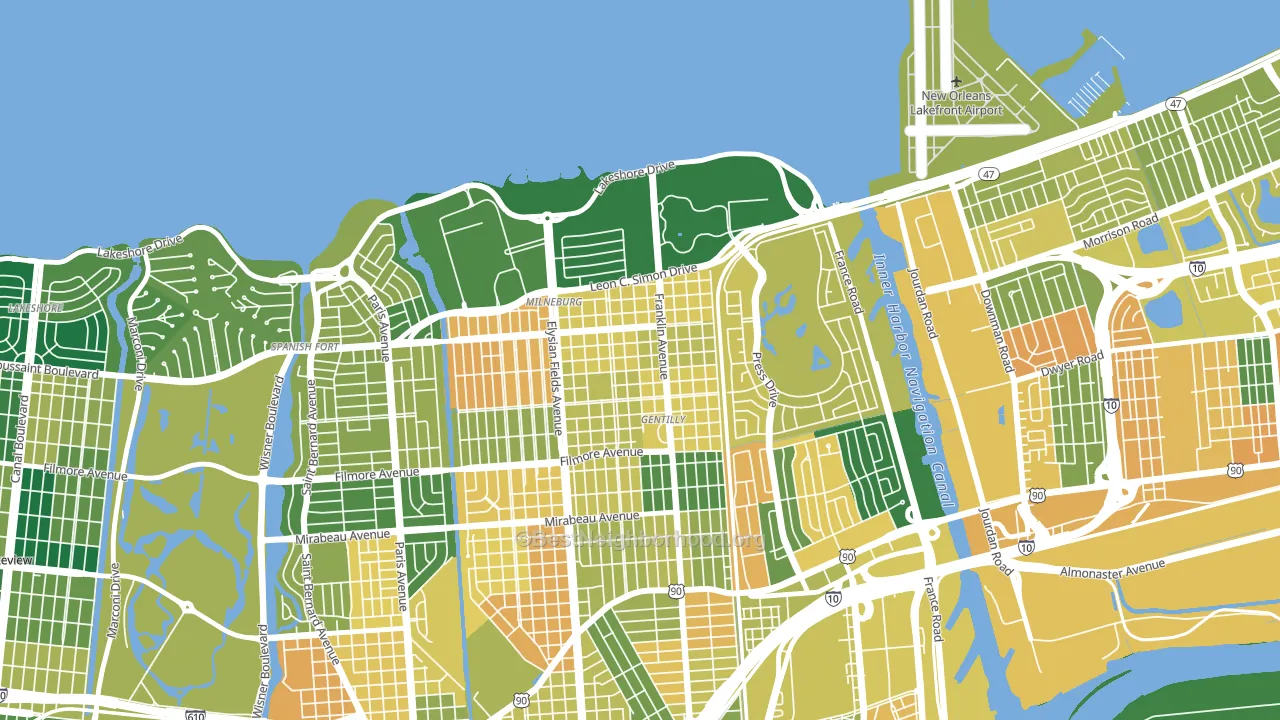
Politics vary noticeably by block within Milneburg. The northeast side is the most Democratic-leaning (D+86) and the northwest side is the least Democratic-leaning (D+70), a spread of about 16 points.
Why Milneburg leans the way it does
This analysis examined 14,881 data points per neighborhood to find what predicts political lean and turnout. The items below are a few correlations that stood out for Milneburg, not a ranked or complete list of what matters most.
Density combined with diversity predicts Democratic voting. Non-Hispanic white share in Milneburg is about 16%, about 56 points below the U.S. average of 72%. A high never-married share predicts Democratic voting, and about 53% of adults in Milneburg have never been married, above 86% of neighborhoods. Milneburg runs against the grain of Louisiana, a Democratic-leaning pocket in a Republican-leaning state.
Population density and Democratic lean
Places with high population density tend to lean Democratic; Milneburg, New Orleans, LA sits in the top quarter nationally on this measure.
Why turnout in Milneburg looks the way it does
Areas with high food insecurity turn out at lower rates. About 35% of adults in Milneburg report food insecurity, about 19 points above the U.S. average of 16%. Learn more about the findings and methodology on the political spectrum map.
Nearby Neighborhoods
- Saint Anthony, New Orleans, LA D+72
- Lake Terrace and Oaks, New Orleans, LA D+41
- Gentilly Woods, New Orleans, LA D+73
- Gentilly Terrace, New Orleans, LA D+75
- Fillmore, New Orleans, LA D+59
- Dillard, New Orleans, LA D+82
- Pines Village, New Orleans, LA D+87
- Lake Shore, New Orleans, LA D+3
- Saint Roch, New Orleans, LA D+79
- Fairgrounds, New Orleans, LA D+68
Neighborhoods with Similar Populations
- Princess Jeanne, Albuquerque, NM D+17
- Forestdale, Hammond, IN D+29
- Silver Bow Park, Butte, MT Even
- Elmhurst Park, Oakland, CA D+56
- Dignowity Hill, San Antonio, TX D+42
- Roselawn, Brighton, NY D+61
- Pinewood-West Palm Beach, West Palm Beach, FL D+38
- Barry Harbour, Kansas City, MO D+13
- Ten Hills, Somerville, MA D+52
- Riviera Bay, St. Petersburg, FL R+7
Sources and methodology
Precinct-level voting records used to fit the model come from Louisiana Secretary of State, Elections, distributed by the Voting and Election Science Team. Demographic inputs come from the U.S. Census Bureau (ACS 5-year estimates and the 2020 Decennial Census). Health and environmental inputs come from the CDC (PLACES and the Environmental Justice Index). Land cover comes from the USGS and EPA. Election-day and lead-up weather come from PRISM 4km daily grids and the NOAA Global Historical Climatology Network. Mail-voting and election-administration patterns come from the MIT Election Lab's Survey of the Performance of American Elections. Block-group crime detail comes from CrimeGrade. Internet data and modeling support provided by ISPreports.org.
Modeling and analysis by the BestNeighborhood data science team. Full methodology and findings: political spectrum map.
Methodology reviewed by the BestNeighborhood data team. Last updated May 2026.