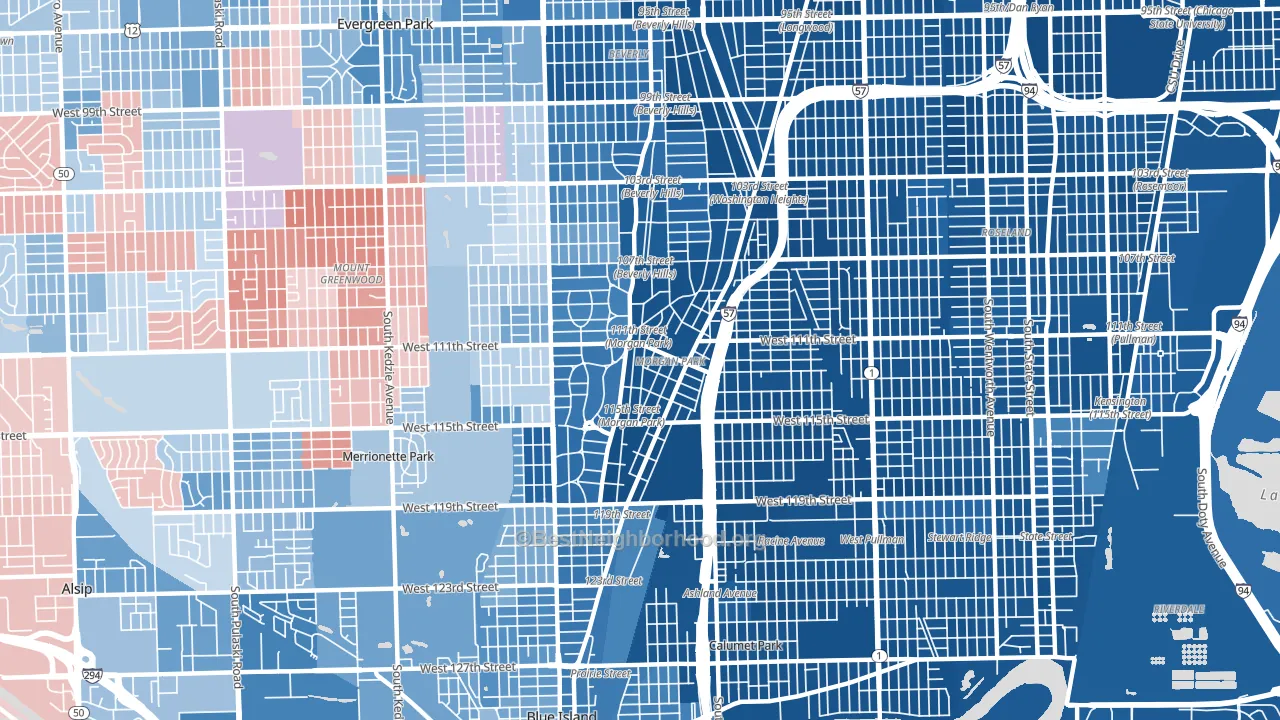
Morgan Park is a Democratic stronghold. About 81% of voters here vote Democratic and 19% Republican.
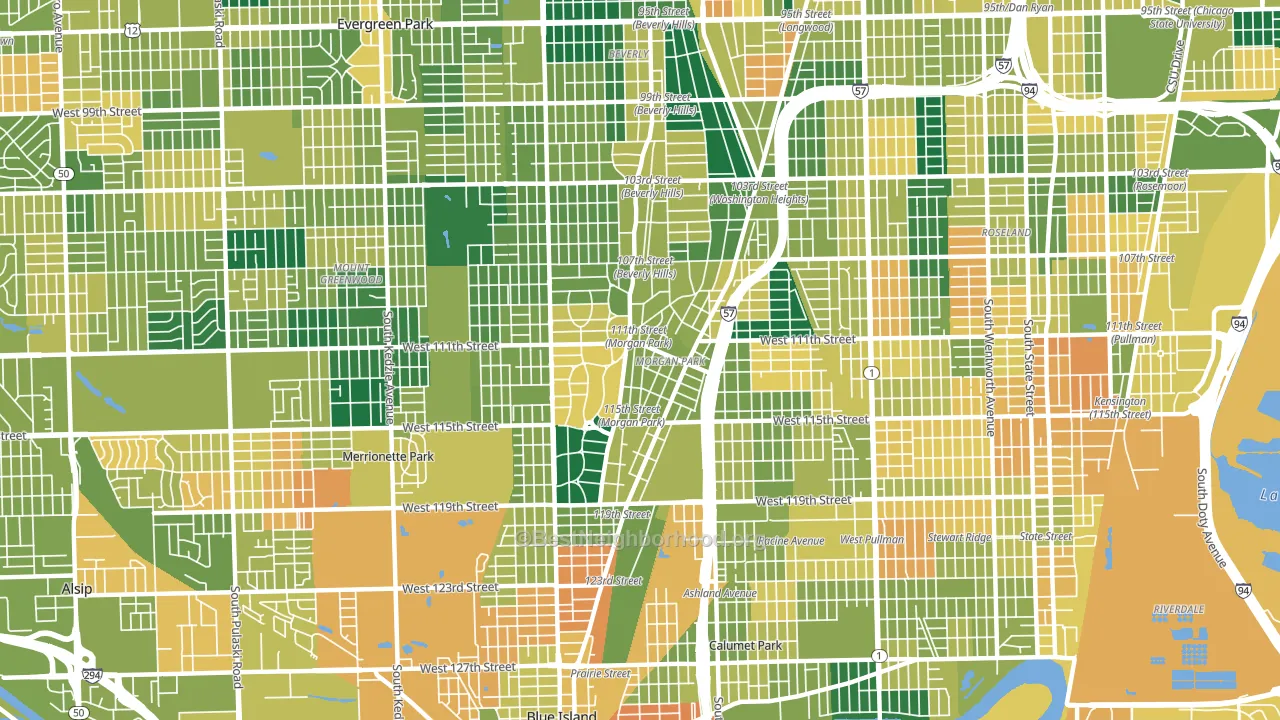
About 74% of adults in Morgan Park typically vote, above the U.S. average of about 62%. Among adults in Morgan Park, ~60% vote Democratic, ~14% Republican, and ~26% don't vote. The map below shows estimated turnout by block group.
How Morgan Park compares
Among neighborhoods within 5 miles, Morgan Park leans more Democratic than 5 of 17 neighbors.
Morgan Park runs about 51 points more Democratic than Illinois as a whole.
Politics vary noticeably by block within Morgan Park. The northeast side is the most Democratic-leaning (D+87) and the northwest side is the least Democratic-leaning (D+3), a spread of about 84 points.
Why Morgan Park leans the way it does
This analysis examined 14,881 data points per neighborhood to find what predicts political lean and turnout. The items below are a few correlations that stood out for Morgan Park, not a ranked or complete list of what matters most.
Dense areas vote Democratic. More than 99% of residents in Morgan Park live in densely developed areas, about 64 points above the U.S. average of 36%.
Walkability and Democratic lean
Places with a highly walkable street grid tend to lean Democratic; Morgan Park, Chicago, IL sits in the top quarter nationally on this measure. A walkable street grid does not change how people vote; it mostly reflects how urban a place is.
Why turnout in Morgan Park looks the way it does
Turnout in Morgan Park sits close to the national pattern. Learn more about the findings and methodology on the political spectrum map.
Nearby Neighborhoods
- Placerdale, Chicago, IL D+85
- Beverly, Chicago, IL D+50
- Brookside Glen, Chicago, IL D+47
- Mount Greenwood, Chicago, IL R+26
- West Pullman, Chicago, IL D+82
- Gano, Chicago, IL D+84
- Washington Heights, Chicago, IL D+85
- Roseland, Chicago, IL D+84
- Brainerd, Chicago, IL D+84
- Pullman, Chicago, IL D+82
Neighborhoods with Similar Populations
- Port Richmond, Staten Island, NY D+24
- Back of the Yards, Chicago, IL D+46
- Deep Creek North, Chesapeake, VA D+18
- Elmwood, Berkeley, CA D+77
- 19th Ward, Rochester, NY D+78
- Woodlawn, Alexandria, VA D+47
- Kensington, Philadelphia, PA D+61
- Beach Haven, Jacksonville, FL R+16
- West Las Vegas, Las Vegas, NV D+52
- North Redlands, Redlands, CA D+6
Sources and methodology
Precinct-level voting records used to fit the model come from Illinois State Board of Elections, distributed by the Voting and Election Science Team. Demographic inputs come from the U.S. Census Bureau (ACS 5-year estimates and the 2020 Decennial Census). Health and environmental inputs come from the CDC (PLACES and the Environmental Justice Index). Land cover comes from the USGS and EPA. Election-day and lead-up weather come from PRISM 4km daily grids and the NOAA Global Historical Climatology Network. Mail-voting and election-administration patterns come from the MIT Election Lab's Survey of the Performance of American Elections. Block-group crime detail comes from CrimeGrade. Internet data and modeling support provided by ISPreports.org.
Modeling and analysis by the BestNeighborhood data science team. Full methodology and findings: political spectrum map.
Methodology reviewed by the BestNeighborhood data team. Last updated May 2026.