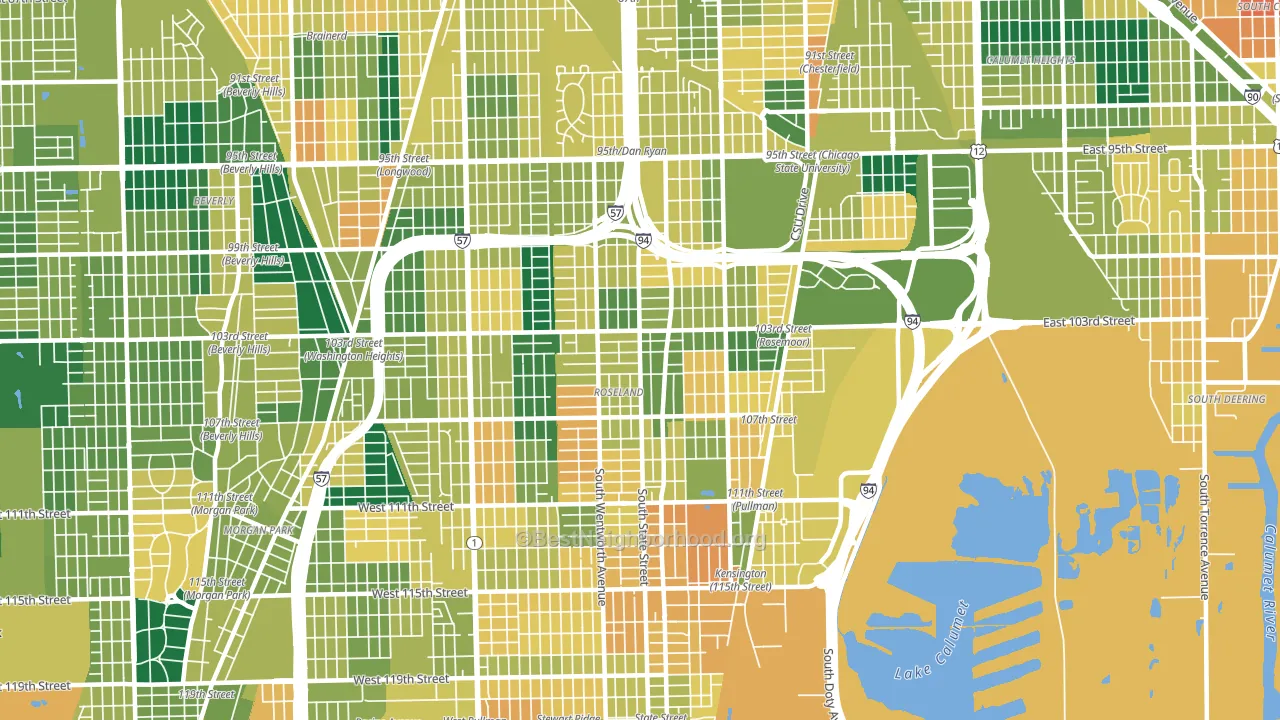
Roseland is a Democratic stronghold. About 92% of voters here vote Democratic and 8% Republican.
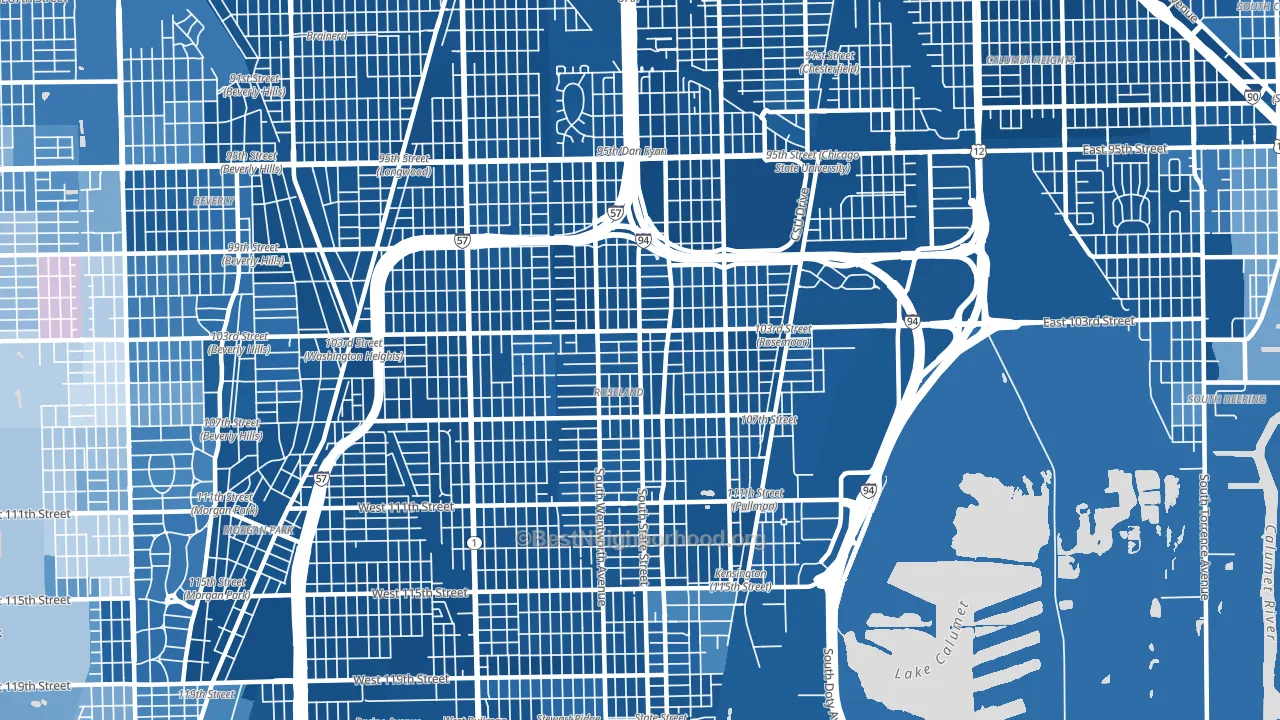
About 60% of adults in Roseland typically vote, near the U.S. average of about 62%. Among adults in Roseland, ~56% vote Democratic, ~5% Republican, and ~39% don't vote. The map below shows estimated turnout by block group.
How Roseland compares
Among neighborhoods within 5 miles, Roseland leans more Democratic than 22 of 30 neighbors.
Roseland runs about 73 points more Democratic than Illinois as a whole.
Why Roseland leans the way it does
This analysis examined 14,881 data points per neighborhood to find what predicts political lean and turnout. The items below are a few correlations that stood out for Roseland, not a ranked or complete list of what matters most.
Dense areas vote Democratic. More than 99% of residents in Roseland live in densely developed areas, about 64 points above the U.S. average of 36%. A high never-married share predicts Democratic voting, and about 52% of adults in Roseland have never been married, above 85% of neighborhoods.
Paved land cover and Democratic lean
Places with extensive paved surfaces tend to lean Democratic; Roseland, Chicago, IL sits in the top quarter nationally on this measure. Paved ground does not change how people vote; it mostly reflects how urban and built-up a place is.
Why turnout in Roseland looks the way it does
Areas with high food insecurity turn out at lower rates. About 37% of adults in Roseland report food insecurity, about 20 points above the U.S. average of 16%. High-crime urban areas turn out at lower rates, and Roseland sits in the top 15% on a violent-crime measure. Learn more about the findings and methodology on the political spectrum map.
Nearby Neighborhoods
- Pullman, Chicago, IL D+82
- Washington Heights, Chicago, IL D+85
- Gano, Chicago, IL D+84
- Placerdale, Chicago, IL D+85
- West Pullman, Chicago, IL D+82
- Chatham, Chicago, IL D+85
- Morgan Park, Chicago, IL D+62
- Beverly, Chicago, IL D+50
- Brainerd, Chicago, IL D+84
- Calumet Heights, Chicago, IL D+85
Neighborhoods with Similar Populations
- North Valleys, Reno, NV R+3
- Little Woods, New Orleans, LA D+83
- La Sierra, Riverside, CA D+9
- Berclair-Highland Heights, Memphis, TN D+23
- Avondale, Chicago, IL D+61
- South Lawndale, Chicago, IL D+41
- West University, Houston, TX D+14
- Charlotte Gardens, Bronx, NY D+50
- Throgs Neck-Edgewater Park, Bronx, NY D+4
- Clairemont Mesa, San Diego, CA D+24
Sources and methodology
Precinct-level voting records used to fit the model come from Illinois State Board of Elections, distributed by the Voting and Election Science Team. Demographic inputs come from the U.S. Census Bureau (ACS 5-year estimates and the 2020 Decennial Census). Health and environmental inputs come from the CDC (PLACES and the Environmental Justice Index). Land cover comes from the USGS and EPA. Election-day and lead-up weather come from PRISM 4km daily grids and the NOAA Global Historical Climatology Network. Mail-voting and election-administration patterns come from the MIT Election Lab's Survey of the Performance of American Elections. Block-group crime detail comes from CrimeGrade. Internet data and modeling support provided by ISPreports.org.
Modeling and analysis by the BestNeighborhood data science team. Full methodology and findings: political spectrum map.
Methodology reviewed by the BestNeighborhood data team. Last updated May 2026.