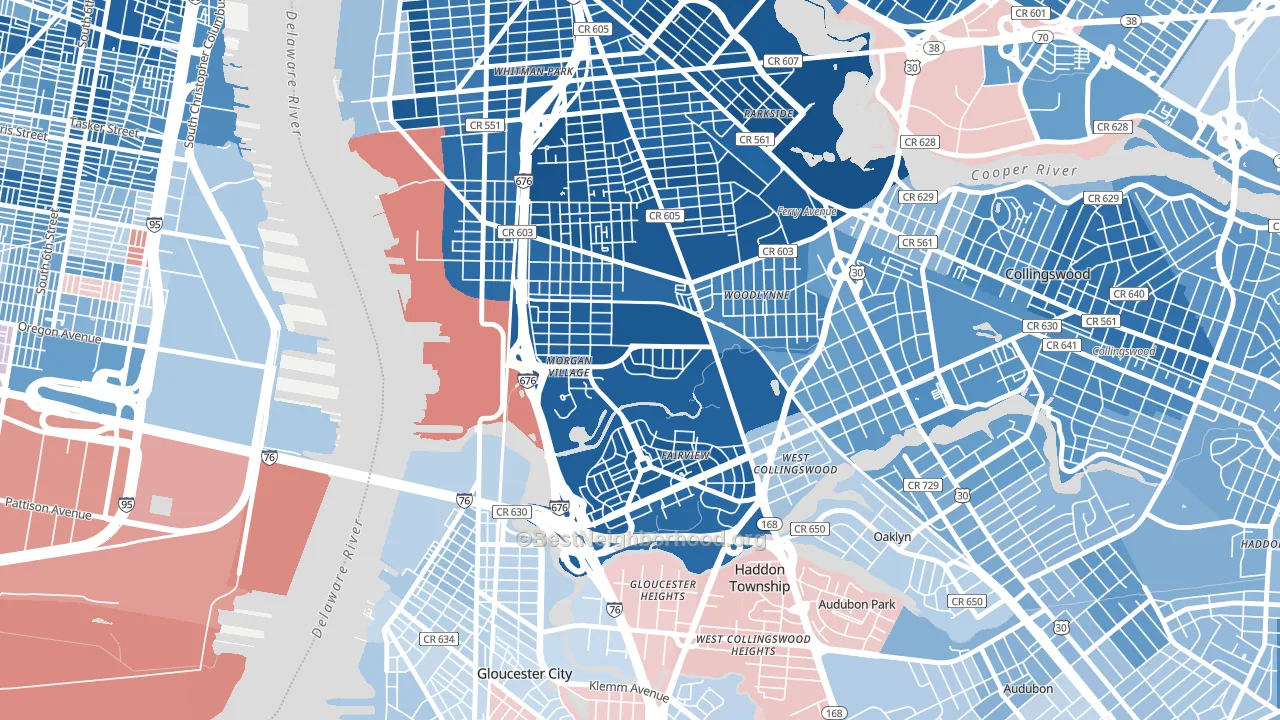
Morgan Village is a Democratic stronghold. About 84% of voters here vote Democratic and 16% Republican.
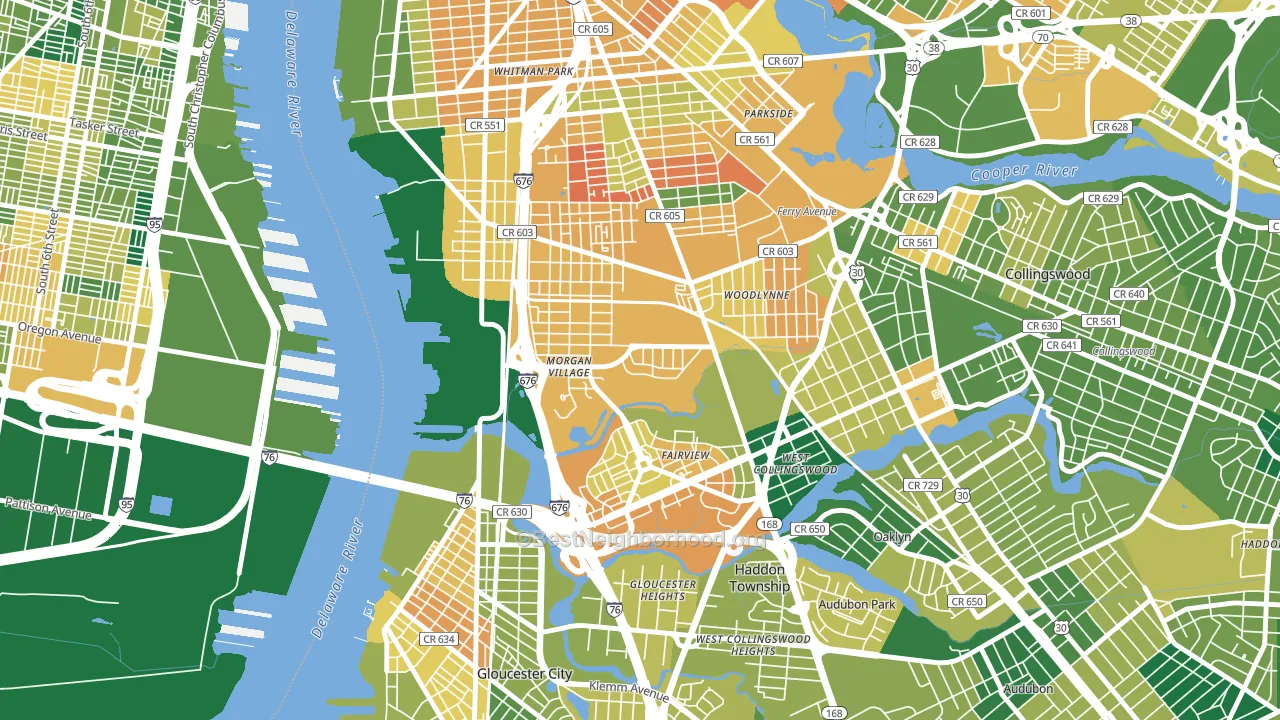
About 44% of adults in Morgan Village typically vote, below the U.S. average of about 62%. Among adults in Morgan Village, ~37% vote Democratic, ~7% Republican, and ~56% don't vote. The map below shows estimated turnout by block group.
How Morgan Village compares
Among neighborhoods within 5 miles, Morgan Village leans more Democratic than 18 of 29 neighbors.
Morgan Village runs about 62 points more Democratic than New Jersey as a whole.
Politics vary noticeably by block within Morgan Village. The southeast side is the most Democratic-leaning (D+74) and the northeast side is the least Democratic-leaning (D+52), a spread of about 22 points.
Why Morgan Village leans the way it does
This analysis examined 14,881 data points per neighborhood to find what predicts political lean and turnout. The items below are a few correlations that stood out for Morgan Village, not a ranked or complete list of what matters most.
Areas with many never-married adults vote Democratic. About 71% of adults in Morgan Village have never been married, far above similar-sized neighborhoods (around 38%).
Population density and Democratic lean
Places with high population density tend to lean Democratic; Morgan Village, Camden, NJ sits in the top quarter nationally on this measure.
Why turnout in Morgan Village looks the way it does
Areas with limited routine healthcare access turn out at lower rates. Morgan Village is in the bottom quarter nationally for routine-care measures such as insurance coverage, preventive screenings, and dental visits. The dental-visit rate here is about 43%, about 25 points below the New Jersey average of 67%. High food insecurity lines up with lower turnout, and about 42% of adults in Morgan Village report food insecurity, above 95% of neighborhoods. Low high-school completion lines up with lower turnout, and about 73% of adults in Morgan Village have completed high school, below 93% of neighborhoods. Learn more about the findings and methodology on the political spectrum map.
Nearby Neighborhoods
- Centerville, Camden, NJ D+72
- Fairview, Camden, NJ D+55
- Whitman Park, Camden, NJ D+78
- Parkside, Camden, NJ D+79
- Lanning Square, Camden, NJ D+68
- Marlton, Camden, NJ D+62
- Pennsport-Whitman-Queen, Philadelphia, PA D+42
- Stockton, Camden, NJ D+53
- Dudley, Camden, NJ D+48
- Pyne Poynt, Camden, NJ D+61
Neighborhoods with Similar Populations
- St. Joseph Historic Neighborhood, Indianapolis, IN D+62
- Berkley Estates, Neptune, NJ D+46
- Catalina Foothills Estates, Catalina Foothills, AZ D+28
- Sylvester Park, Pasco, WA D+17
- Lake View, Kirkland, WA D+53
- Northwood, Tamarac, FL D+20
- 6th Ward, Allentown, PA D+14
- Wyndham Lakes Estates, Meadow Woods, FL D+12
- Putnam Heights, Eau Claire, WI D+20
- Brierwood, Jacksonville, FL R+11
Sources and methodology
Precinct-level voting records used to fit the model come from New Jersey Division of Elections, distributed by the Voting and Election Science Team. Demographic inputs come from the U.S. Census Bureau (ACS 5-year estimates and the 2020 Decennial Census). Health and environmental inputs come from the CDC (PLACES and the Environmental Justice Index). Land cover comes from the USGS and EPA. Election-day and lead-up weather come from PRISM 4km daily grids and the NOAA Global Historical Climatology Network. Mail-voting and election-administration patterns come from the MIT Election Lab's Survey of the Performance of American Elections. Block-group crime detail comes from CrimeGrade. Internet data and modeling support provided by ISPreports.org.
Modeling and analysis by the BestNeighborhood data science team. Full methodology and findings: political spectrum map.
Methodology reviewed by the BestNeighborhood data team. Last updated May 2026.