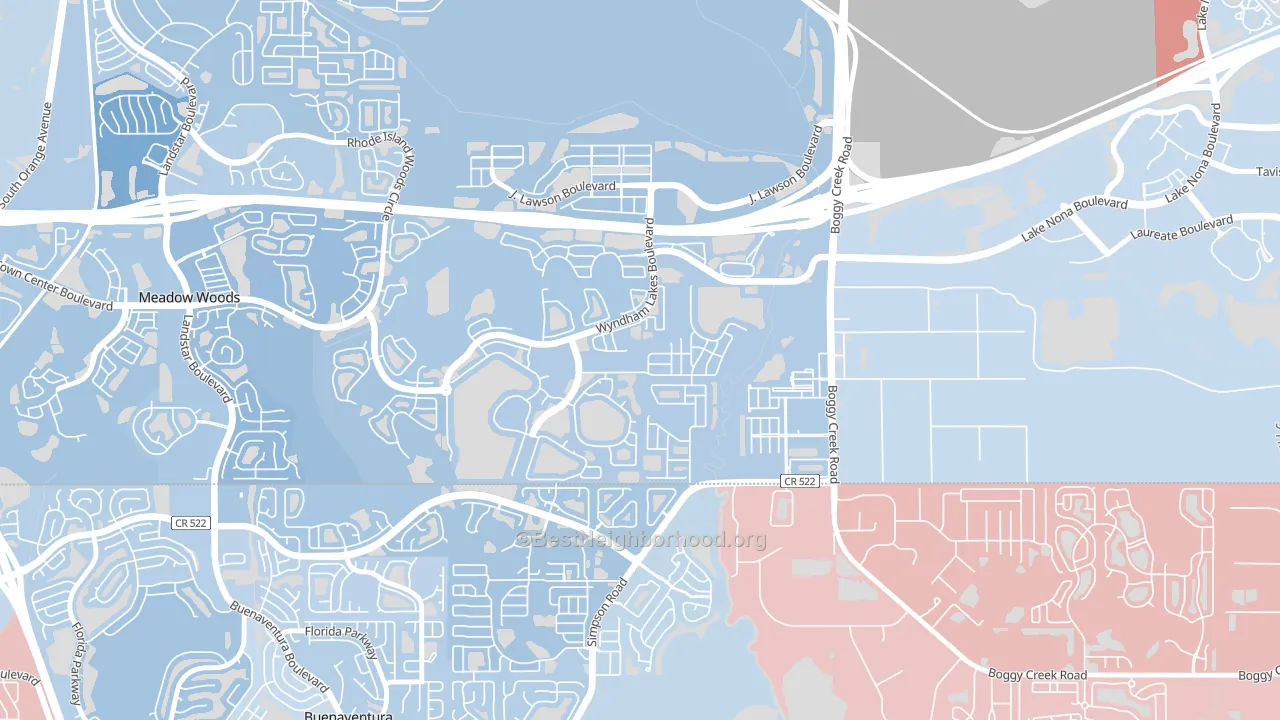
Wyndham Lakes Estates leans slightly Democratic by roughly 12 points: about 56% of voters vote Democratic and 44% Republican.
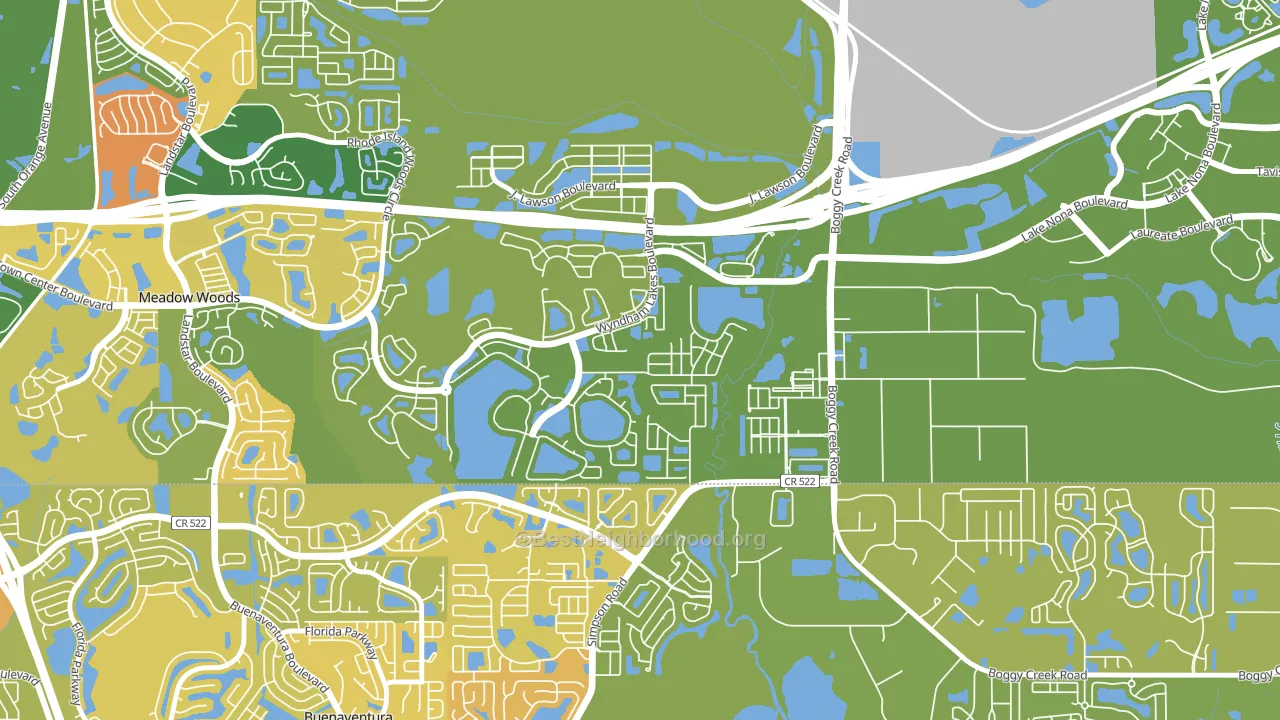
About 74% of adults in Wyndham Lakes Estates typically vote, above the U.S. average of about 62%. Among adults in Wyndham Lakes Estates, ~41% vote Democratic, ~33% Republican, and ~26% don't vote. The map below shows estimated turnout by block group.
How Wyndham Lakes Estates compares
Among neighborhoods within 5 miles, Wyndham Lakes Estates is the most Democratic-leaning.
Wyndham Lakes Estates runs about 25 points more Democratic than Florida as a whole. Florida leans Republican overall, while Wyndham Lakes Estates is one of the few Democratic-leaning pockets.
Why Wyndham Lakes Estates leans the way it does
This analysis examined 14,881 data points per neighborhood to find what predicts political lean and turnout. The items below are a few correlations that stood out for Wyndham Lakes Estates, not a ranked or complete list of what matters most.
Wyndham Lakes Estates votes against the grain of Florida. Florida leans Republican overall, while Wyndham Lakes Estates runs about 25 points more Democratic.
Non-English at home and voter turnout
Places with a low non-English-at-home share tend to turn out at a higher rate; Wyndham Lakes Estates, Meadow Woods, FL sits in the bottom tenth nationally on this measure.
Why turnout in Wyndham Lakes Estates looks the way it does
Homeowners vote more often than renters. About 87% of households in Wyndham Lakes Estates own their home, about 16 points above the Florida average of 71%. Learn more about the findings and methodology on the political spectrum map.
Nearby Neighborhoods
- Beacon Park, Meadow Woods, FL D+10
- Eagle Bay, Kissimmee, FL D+11
- Raintree, Kissimmee, FL R+5
- Southchase Village, Southchase, FL D+7
- Falcon Trace, Southchase, FL D+10
- Lake Nona, Orlando, FL R+4
- Northlake Park at Lake Nona, Orlando, FL R+6
- Bal Bay, Orlando, FL Even
- Airport North, Orlando, FL D+21
- Waterway Village, Kissimmee, FL D+6
Neighborhoods with Similar Populations
- Queensboro-Brentwood-Crystal Spgs, Bothell, WA D+29
- Putnam Heights, Eau Claire, WI D+20
- Downtown Burlingame, Burlingame, CA D+52
- Northwood, Tamarac, FL D+20
- Downtown Lynn Haven, Lynn Haven, FL R+35
- St. Joseph Historic Neighborhood, Indianapolis, IN D+62
- Berkley Estates, Neptune, NJ D+46
- San Tan Ranch, Gilbert, AZ R+16
- Catalina Foothills Estates, Catalina Foothills, AZ D+28
- Morgan Village, Camden, NJ D+68
Sources and methodology
Precinct-level voting records used to fit the model come from Florida Division of Elections, distributed by the Voting and Election Science Team. Demographic inputs come from the U.S. Census Bureau (ACS 5-year estimates and the 2020 Decennial Census). Health and environmental inputs come from the CDC (PLACES and the Environmental Justice Index). Land cover comes from the USGS and EPA. Election-day and lead-up weather come from PRISM 4km daily grids and the NOAA Global Historical Climatology Network. Mail-voting and election-administration patterns come from the MIT Election Lab's Survey of the Performance of American Elections. Block-group crime detail comes from CrimeGrade. Internet data and modeling support provided by ISPreports.org.
Modeling and analysis by the BestNeighborhood data science team. Full methodology and findings: political spectrum map.
Methodology reviewed by the BestNeighborhood data team. Last updated May 2026.