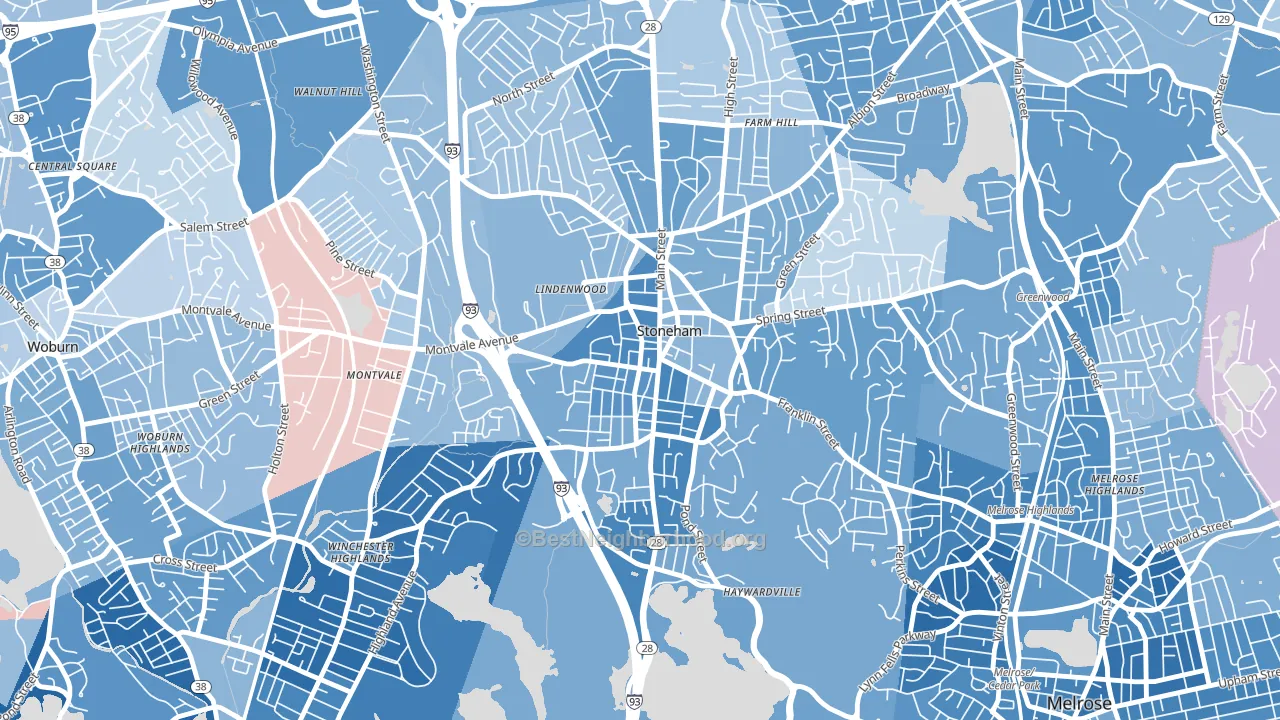
Nobility Hill Historic District leans Democratic by roughly 28 points: about 64% of voters vote Democratic and 36% Republican.
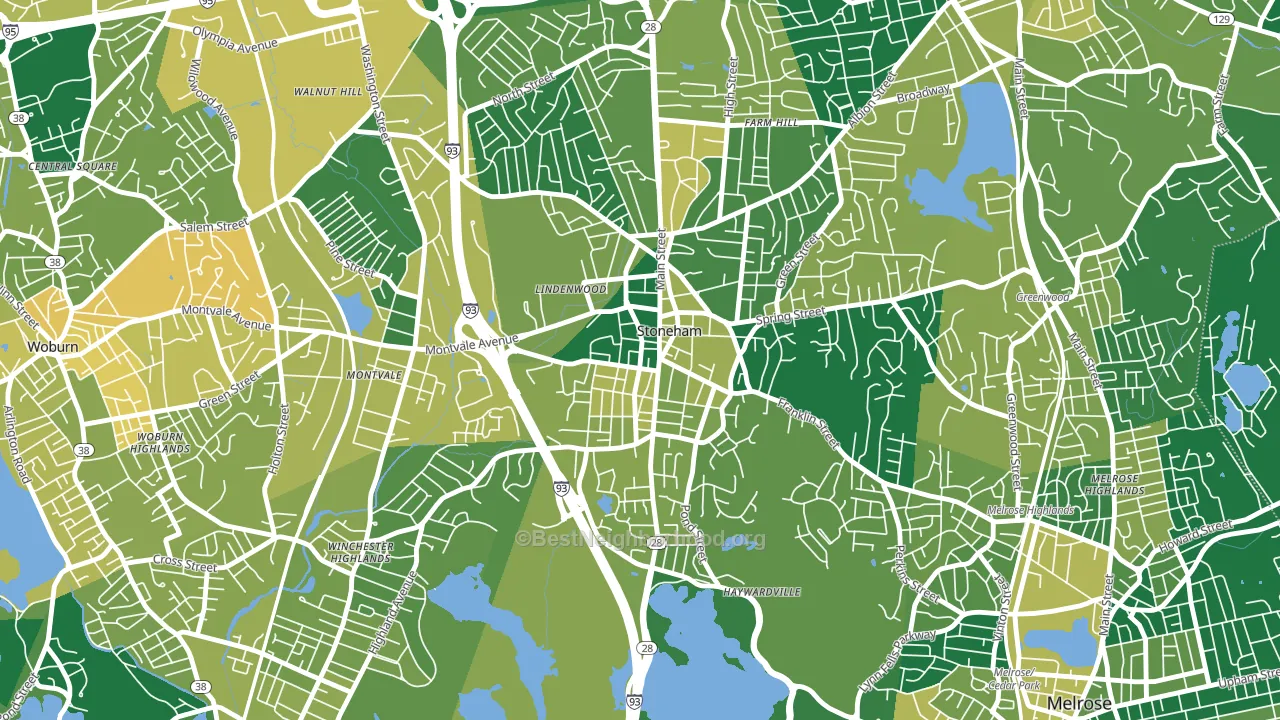
About 83% of adults in Nobility Hill Historic District typically vote, above the U.S. average of about 62%. Among adults in Nobility Hill Historic District, ~53% vote Democratic, ~30% Republican, and ~17% don't vote. The map below shows estimated turnout by block group.
How Nobility Hill Historic District compares
Among neighborhoods within 5 miles, Nobility Hill Historic District is the least Democratic-leaning.
Politically, Nobility Hill Historic District sits close to the rest of Massachusetts.
Politics vary noticeably by block within Nobility Hill Historic District. The west side is the most Democratic-leaning (D+32) and the northeast side is the least Democratic-leaning (D+15), a spread of about 17 points.
Why Nobility Hill Historic District leans the way it does
Density, race composition, education, and family structure all sit close to their national averages in Nobility Hill Historic District. The lean here lands roughly where demographic data alone would predict.
Cancer-screening access and voter turnout
Places with high colon-cancer-screening access tend to turn out at a higher rate; Nobility Hill Historic District, Stoneham, MA sits in the top tenth nationally on this measure. Cancer screening does not drive turnout; it reflects income, insurance, and healthcare access.
Why turnout in Nobility Hill Historic District looks the way it does
Areas with strong routine healthcare access turn out at higher rates. Nobility Hill Historic District is in the top quarter nationally for routine-care measures such as insurance coverage, preventive screenings, and dental visits. The dental-visit rate here is about 73%, about 13 points above the U.S. average of 60%. Learn more about the findings and methodology on the political spectrum map.
Nearby Neighborhoods
- Woburn Street Historic District, Reading, MA D+33
- Wedgemere Historic District, Winchester, MA D+52
- Bryant Terrace, Malden, MA D+42
- Bowdoin Apartments, Malden, MA D+37
- Arlington Center, Arlington, MA D+71
- West Somerville, Somerville, MA D+63
- Tufts, Somerville, MA D+71
- Arlington Heights, Arlington, MA D+63
- Ball Square, Somerville, MA D+70
- Ten Hills, Somerville, MA D+52
Neighborhoods with Similar Populations
- El Dorado Park, Long Beach, CA D+23
- Cushing Square, Belmont, MA D+67
- Bridlemile, Portland, OR D+61
- Downtown Newport News, Newport News, VA D+45
- Piety Corner, Waltham, MA D+37
- Victorian Village, Columbus, OH D+60
- Lacy, Santa Ana, CA D+31
- Calico Ridge, Henderson, NV R+4
- Creekside, Sacramento, CA D+33
- North Redmond, Redmond, WA D+42
Sources and methodology
Precinct-level voting records used to fit the model come from Massachusetts Secretary of the Commonwealth, Elections, distributed by the Voting and Election Science Team. Demographic inputs come from the U.S. Census Bureau (ACS 5-year estimates and the 2020 Decennial Census). Health and environmental inputs come from the CDC (PLACES and the Environmental Justice Index). Land cover comes from the USGS and EPA. Election-day and lead-up weather come from PRISM 4km daily grids and the NOAA Global Historical Climatology Network. Mail-voting and election-administration patterns come from the MIT Election Lab's Survey of the Performance of American Elections. Block-group crime detail comes from CrimeGrade. Internet data and modeling support provided by ISPreports.org.
Modeling and analysis by the BestNeighborhood data science team. Full methodology and findings: political spectrum map.
Methodology reviewed by the BestNeighborhood data team. Last updated May 2026.