Woburn Street Historic District leans heavily Democratic by roughly 34 points: about 67% of voters vote Democratic and 33% Republican.

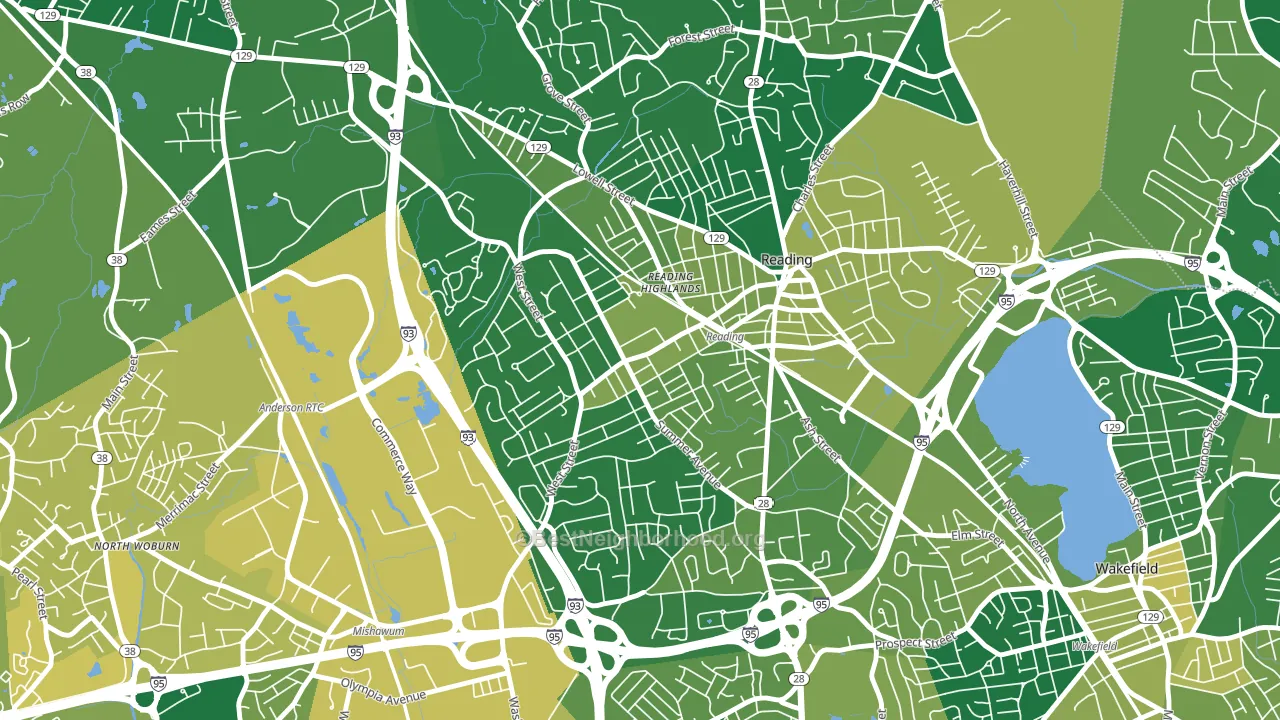
About 86% of adults in Woburn Street Historic District typically vote, above the U.S. average of about 62%. Among adults in Woburn Street Historic District, ~58% vote Democratic, ~28% Republican, and ~14% don't vote. The map below shows estimated turnout by block group.
How Woburn Street Historic District compares
Woburn Street Historic District runs about 8 points more Democratic than Massachusetts as a whole.
Politics vary noticeably by block within Woburn Street Historic District. The northeast side is the most Democratic-leaning (D+44) and the southeast side is the least Democratic-leaning (D+22), a spread of about 22 points.
Why Woburn Street Historic District leans the way it does
This analysis examined 14,881 data points per neighborhood to find what predicts political lean and turnout. The items below are a few correlations that stood out for Woburn Street Historic District, not a ranked or complete list of what matters most.
Areas with high college attainment vote Democratic. About 71% of adults in Woburn Street Historic District hold a bachelor's degree, about 42 points above the U.S. average of 28%.
Food insecurity and voter turnout
Places with low food insecurity tend to turn out at a higher rate; Woburn Street Historic District, Reading, MA sits in the bottom tenth nationally on this measure. Food insecurity does not directly drive turnout; it reflects economic hardship, which lines up with lower voting.
Why turnout in Woburn Street Historic District looks the way it does
Areas with strong routine healthcare access turn out at higher rates. Woburn Street Historic District is in the top quarter nationally for routine-care measures such as insurance coverage, preventive screenings, and dental visits. The dental-visit rate here is about 77%, about 17 points above the U.S. average of 60%. High high-school completion lines up with higher turnout, and about 98% of adults in Woburn Street Historic District have completed high school, above 83% of neighborhoods. Learn more about the findings and methodology on the political spectrum map.
Nearby Neighborhoods
- Nobility Hill Historic District, Stoneham, MA D+27
- Wedgemere Historic District, Winchester, MA D+52
- Bowdoin Apartments, Malden, MA D+37
- Bryant Terrace, Malden, MA D+42
- Arlington Heights, Arlington, MA D+63
- Arlington Center, Arlington, MA D+71
- West Somerville, Somerville, MA D+63
- Tufts, Somerville, MA D+71
- Ball Square, Somerville, MA D+70
- North Cambridge, Cambridge, MA D+71
Neighborhoods with Similar Populations
- Paloma Lake, Round Rock, TX D+5
- Belle Valley, Erie, PA R+4
- Milan, New Orleans, LA D+62
- Route 66 Historic District, Amarillo, TX R+12
- Vine, Kalamazoo, MI D+51
- Neighborhood Nine, Cambridge, MA D+78
- Fordville, Southgate, MI R+8
- Sunshine, Lehigh Acres, FL D+6
- Boal, Chula Vista, CA D+23
- Stone Meadows, Bakersfield, CA R+4
Sources and methodology
Precinct-level voting records used to fit the model come from Massachusetts Secretary of the Commonwealth, Elections, distributed by the Voting and Election Science Team. Demographic inputs come from the U.S. Census Bureau (ACS 5-year estimates and the 2020 Decennial Census). Health and environmental inputs come from the CDC (PLACES and the Environmental Justice Index). Land cover comes from the USGS and EPA. Election-day and lead-up weather come from PRISM 4km daily grids and the NOAA Global Historical Climatology Network. Mail-voting and election-administration patterns come from the MIT Election Lab's Survey of the Performance of American Elections. Block-group crime detail comes from CrimeGrade. Internet data and modeling support provided by ISPreports.org.
Modeling and analysis by the BestNeighborhood data science team. Full methodology and findings: political spectrum map.
Methodology reviewed by the BestNeighborhood data team. Last updated May 2026.