North Loop is a Democratic stronghold. About 84% of voters here vote Democratic and 16% Republican.
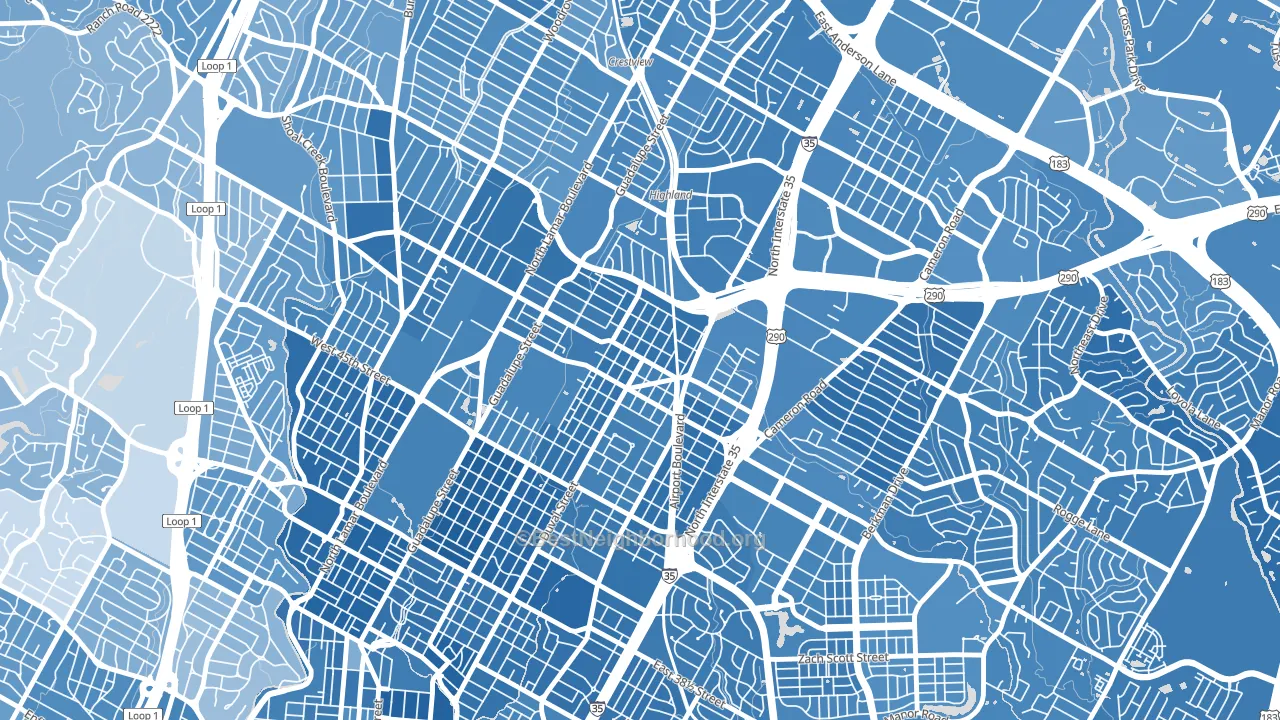
About 61% of adults in North Loop typically vote, near the U.S. average of about 62%. Among adults in North Loop, ~51% vote Democratic, ~10% Republican, and ~39% don't vote. The map below shows estimated turnout by block group.
How North Loop compares
Among neighborhoods within 5 miles, North Loop leans more Democratic than 30 of 34 neighbors.
North Loop runs about 82 points more Democratic than Texas as a whole. Texas leans Republican overall, while North Loop is one of the few Democratic-leaning pockets.
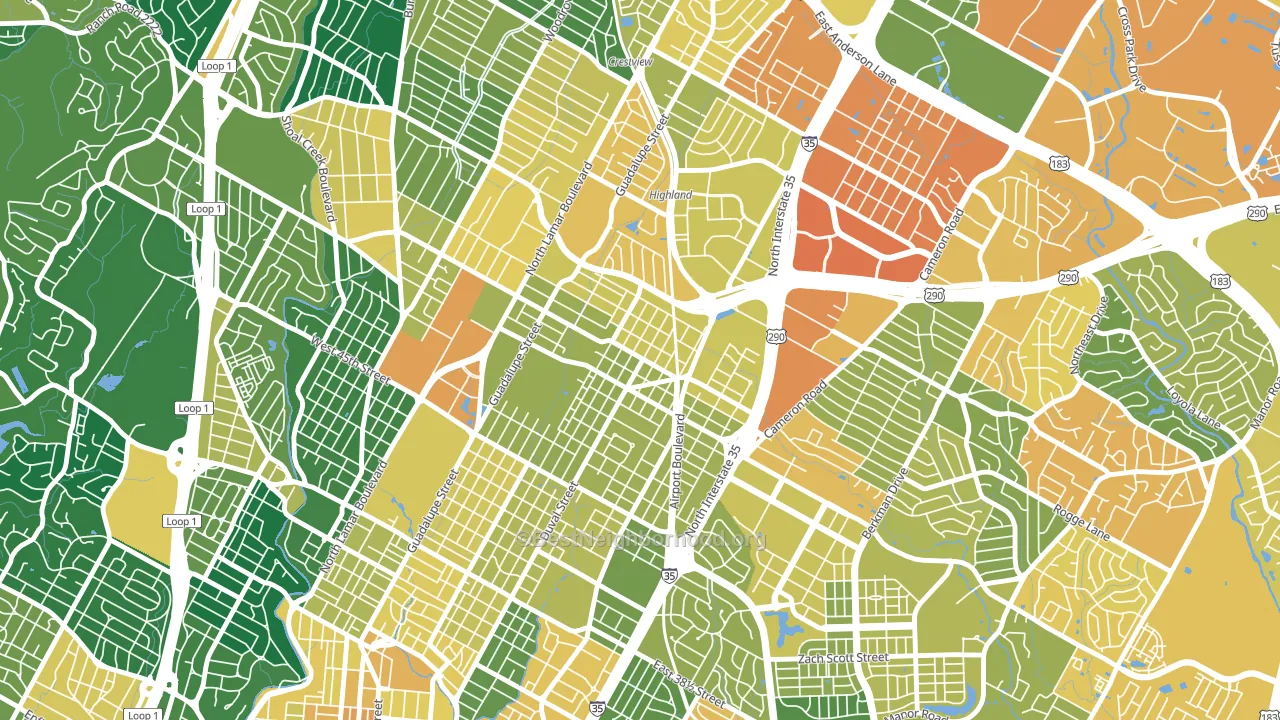
Politics vary noticeably by block within North Loop. The south side is the most Democratic-leaning (D+76) and the east side is the least Democratic-leaning (D+56), a spread of about 19 points.
Why North Loop leans the way it does
This analysis examined 14,881 data points per neighborhood to find what predicts political lean and turnout. The items below are a few correlations that stood out for North Loop, not a ranked or complete list of what matters most.
Areas with high college attainment vote Democratic. About 80% of adults in North Loop hold a bachelor's degree, about 52 points above the U.S. average of 28%. Dense areas vote Democratic, and North Loop sits in the top fifth on density (more than 99%, above 89% of neighborhoods). North Loop runs against the grain of Texas, a Democratic-leaning pocket in a Republican-leaning state.
Paved land cover and Democratic lean
Places with extensive paved surfaces tend to lean Democratic; North Loop, Austin, TX sits in the top quarter nationally on this measure. Paved ground does not change how people vote; it mostly reflects how urban and built-up a place is.
Why turnout in North Loop looks the way it does
Renters vote less often than owners. About 76% of households in North Loop rent, about 51 points above the U.S. average of 25%. Learn more about the findings and methodology on the political spectrum map.
Nearby Neighborhoods
- Hyde Park, Austin, TX D+71
- Brentwood, Austin, TX D+59
- Highland, Austin, TX D+61
- Hancock, Austin, TX D+65
- Saint Johns, Austin, TX D+54
- Windsor Park, Austin, TX D+59
- Rmma, Austin, TX D+61
- North University, Austin, TX D+72
- Upper Boggy Creek, Austin, TX D+69
- Crestview, Austin, TX D+66
Neighborhoods with Similar Populations
- Arbor Heights, Seattle, WA D+66
- Utah Park, Aurora, CO D+34
- Elizabeth, Charlotte, NC D+52
- Hancock, Austin, TX D+65
- Merry Oaks, Nashville, TN D+5
- Northwest Triangle, York, PA D+40
- Virginia Park, Tampa, FL D+2
- Stafford-Tualatin Valley, West Linn, OR D+21
- Davis Island, Tampa, FL R+10
- North Central, Raleigh, NC D+67
Sources and methodology
Precinct-level voting records used to fit the model come from Texas Secretary of State, Elections Division, distributed by the Voting and Election Science Team. Demographic inputs come from the U.S. Census Bureau (ACS 5-year estimates and the 2020 Decennial Census). Health and environmental inputs come from the CDC (PLACES and the Environmental Justice Index). Land cover comes from the USGS and EPA. Election-day and lead-up weather come from PRISM 4km daily grids and the NOAA Global Historical Climatology Network. Mail-voting and election-administration patterns come from the MIT Election Lab's Survey of the Performance of American Elections. Block-group crime detail comes from CrimeGrade. Internet data and modeling support provided by ISPreports.org.
Modeling and analysis by the BestNeighborhood data science team. Full methodology and findings: political spectrum map.
Methodology reviewed by the BestNeighborhood data team. Last updated May 2026.