Northside leans Democratic by roughly 28 points: about 64% of voters vote Democratic and 36% Republican.
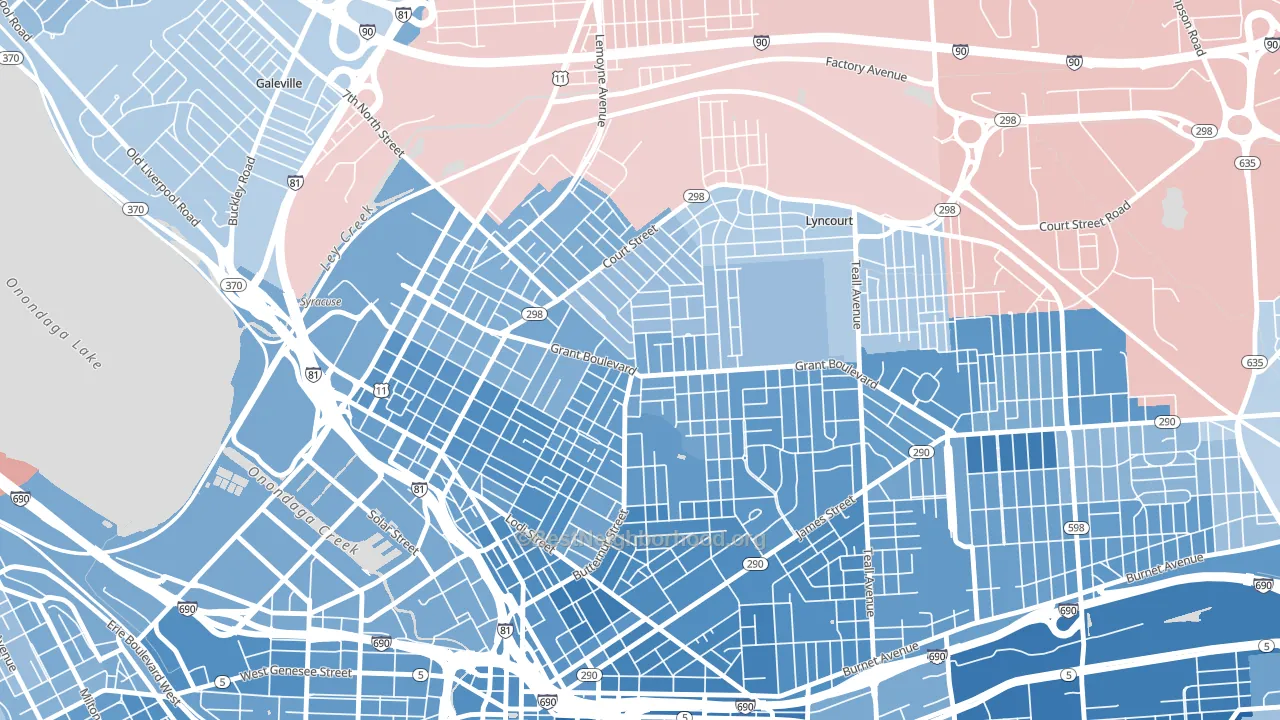
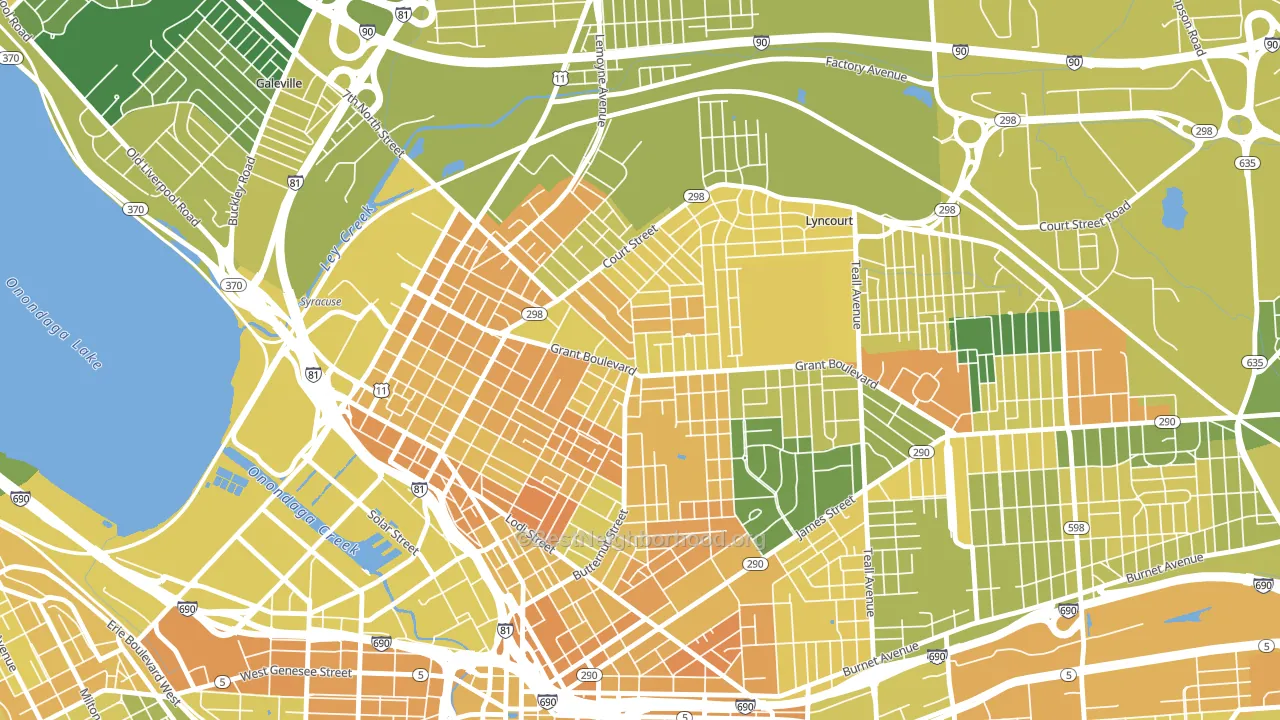
About 45% of adults in Northside typically vote, below the U.S. average of about 62%. Among adults in Northside, ~29% vote Democratic, ~16% Republican, and ~55% don't vote. The map below shows estimated turnout by block group.
How Northside compares
Among neighborhoods within 5 miles, Northside leans more Democratic than 2 of 22 neighbors.
Northside runs about 15 points more Democratic than New York as a whole.
Politics vary noticeably by block within Northside. The south side is the most Democratic-leaning (D+39) and the northeast side is the least Democratic-leaning (D+13), a spread of about 25 points.
Why Northside leans the way it does
This analysis examined 14,881 data points per neighborhood to find what predicts political lean and turnout. The items below are a few correlations that stood out for Northside, not a ranked or complete list of what matters most.
Dense areas vote Democratic. More than 99% of residents in Northside live in densely developed areas, about 64 points above the U.S. average of 36%.
Walkability and Democratic lean
Places with a highly walkable street grid tend to lean Democratic; Northside, Syracuse, NY sits in the top quarter nationally on this measure. A walkable street grid does not change how people vote; it mostly reflects how urban a place is.
Why turnout in Northside looks the way it does
Crowded housing lines up with lower turnout. About 7% of homes in Northside have more than one occupant per room, above 83% of neighborhoods. Low high-school completion lines up with lower turnout, and about 81% of adults in Northside have completed high school, below 84% of neighborhoods. Learn more about the findings and methodology on the political spectrum map.
Nearby Neighborhoods
- Washington Square, Syracuse, NY D+32
- Near Northeast, Syracuse, NY D+48
- Lincoln Park-Syracuse, Syracuse, NY D+42
- Eastwood, Syracuse, NY D+37
- Downtown Syracuse, Syracuse, NY D+63
- Near Eastside, Syracuse, NY D+69
- Westside, Syracuse, NY D+37
- University Hill, Syracuse, NY D+58
- Galeville, Liverpool, NY D+16
- Near Westside, Syracuse, NY D+53
Neighborhoods with Similar Populations
- Prince's Bay, Staten Island, NY R+56
- Highland Park, San Antonio, TX D+34
- Portola Springs, Irvine, CA D+15
- Verdugo Viejo, Glendale, CA D+15
- Bay Ho, San Diego, CA D+27
- Oakridge, Bakersfield, CA D+11
- Green Mountain, Lakewood, CO D+20
- South Trenton, Trenton, NJ D+45
- South East Torrance, Torrance, CA D+16
- Civic Center Little Tokyo, Los Angeles, CA D+48
Sources and methodology
Precinct-level voting records used to fit the model come from New York State Board of Elections, distributed by the Voting and Election Science Team. Demographic inputs come from the U.S. Census Bureau (ACS 5-year estimates and the 2020 Decennial Census). Health and environmental inputs come from the CDC (PLACES and the Environmental Justice Index). Land cover comes from the USGS and EPA. Election-day and lead-up weather come from PRISM 4km daily grids and the NOAA Global Historical Climatology Network. Mail-voting and election-administration patterns come from the MIT Election Lab's Survey of the Performance of American Elections. Block-group crime detail comes from CrimeGrade. Internet data and modeling support provided by ISPreports.org.
Modeling and analysis by the BestNeighborhood data science team. Full methodology and findings: political spectrum map.
Methodology reviewed by the BestNeighborhood data team. Last updated May 2026.