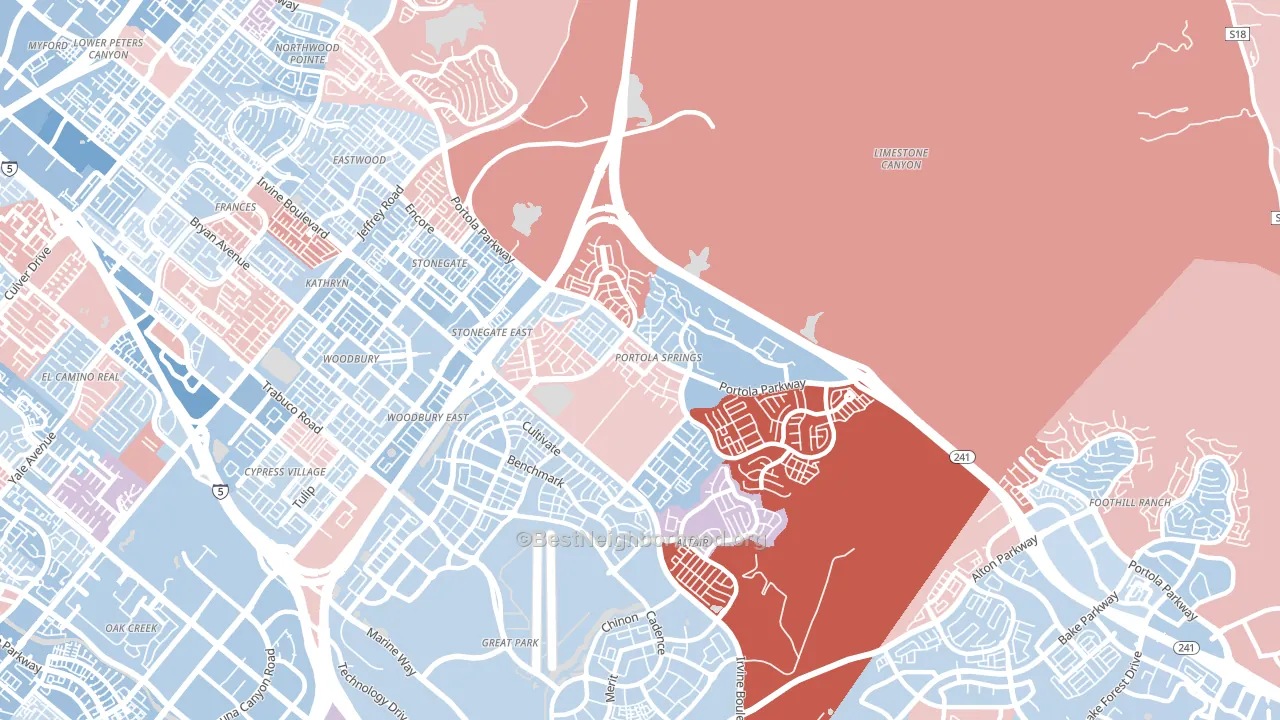
Portola Springs leans slightly Democratic by roughly 14 points: about 57% of voters vote Democratic and 43% Republican.
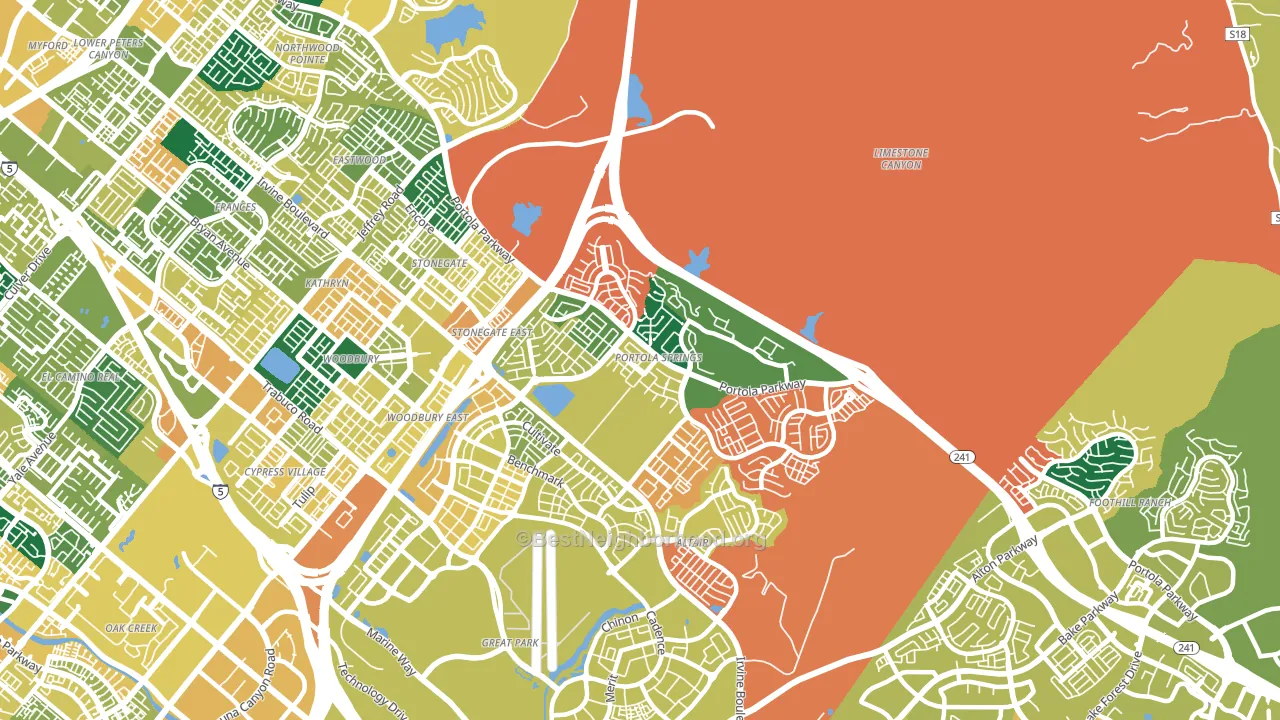
About 62% of adults in Portola Springs typically vote, near the U.S. average of about 62%. Among adults in Portola Springs, ~35% vote Democratic, ~27% Republican, and ~38% don't vote. The map below shows estimated turnout by block group.
How Portola Springs compares
Among neighborhoods within 5 miles, Portola Springs leans more Democratic than 10 of 14 neighbors.
Portola Springs runs about 5 points more Republican than California as a whole.
Politics vary noticeably by block within Portola Springs. The southeast side is the most Democratic-leaning (D+17) and the north side is the least Democratic-leaning (D+6), a spread of about 11 points.
Why Portola Springs leans the way it does
This analysis examined 14,881 data points per neighborhood to find what predicts political lean and turnout. The items below are a few correlations that stood out for Portola Springs, not a ranked or complete list of what matters most.
Areas with high college attainment vote Democratic. About 73% of adults in Portola Springs hold a bachelor's degree, about 45 points above the U.S. average of 28%.
Population density, never-married share, and Democratic lean
Places that combine high population density and a low never-married share tend to lean Democratic, as Portola Springs, Irvine, CA does.
Why turnout in Portola Springs looks the way it does
Turnout in Portola Springs sits close to the national pattern. Routine healthcare access, homeownership, education, and food security all land near their national averages here. Learn more about the findings and methodology on the political spectrum map.
Nearby Neighborhoods
- Orange County Great Park, Irvine, CA D+19
- El Toro Marine Air Station, Irvine, CA D+18
- Woodbury, Irvine, CA D+16
- Spectrum, Irvine, CA D+14
- Northwood Point, Irvine, CA D+8
- Northwood, Irvine, CA D+10
- Irvine Health and Science Complex, Irvine, CA D+23
- Orchard Hills, Irvine, CA D+6
- El Camino Real, Irvine, CA D+10
- Lower Peters Canyon, Irvine, CA D+13
Neighborhoods with Similar Populations
- Verdugo Viejo, Glendale, CA D+15
- Green Mountain, Lakewood, CO D+20
- Northside, Syracuse, NY D+27
- Prince's Bay, Staten Island, NY R+56
- Highland Park, San Antonio, TX D+34
- Bay Ho, San Diego, CA D+27
- Civic Center Little Tokyo, Los Angeles, CA D+48
- Oakridge, Bakersfield, CA D+11
- Main Middle, Worcester, MA D+31
- South Trenton, Trenton, NJ D+45
Sources and methodology
Precinct-level voting records used to fit the model come from California Secretary of State, Elections, distributed by the Voting and Election Science Team. Demographic inputs come from the U.S. Census Bureau (ACS 5-year estimates and the 2020 Decennial Census). Health and environmental inputs come from the CDC (PLACES and the Environmental Justice Index). Land cover comes from the USGS and EPA. Election-day and lead-up weather come from PRISM 4km daily grids and the NOAA Global Historical Climatology Network. Mail-voting and election-administration patterns come from the MIT Election Lab's Survey of the Performance of American Elections. Block-group crime detail comes from CrimeGrade. Internet data and modeling support provided by ISPreports.org.
Modeling and analysis by the BestNeighborhood data science team. Full methodology and findings: political spectrum map.
Methodology reviewed by the BestNeighborhood data team. Last updated May 2026.