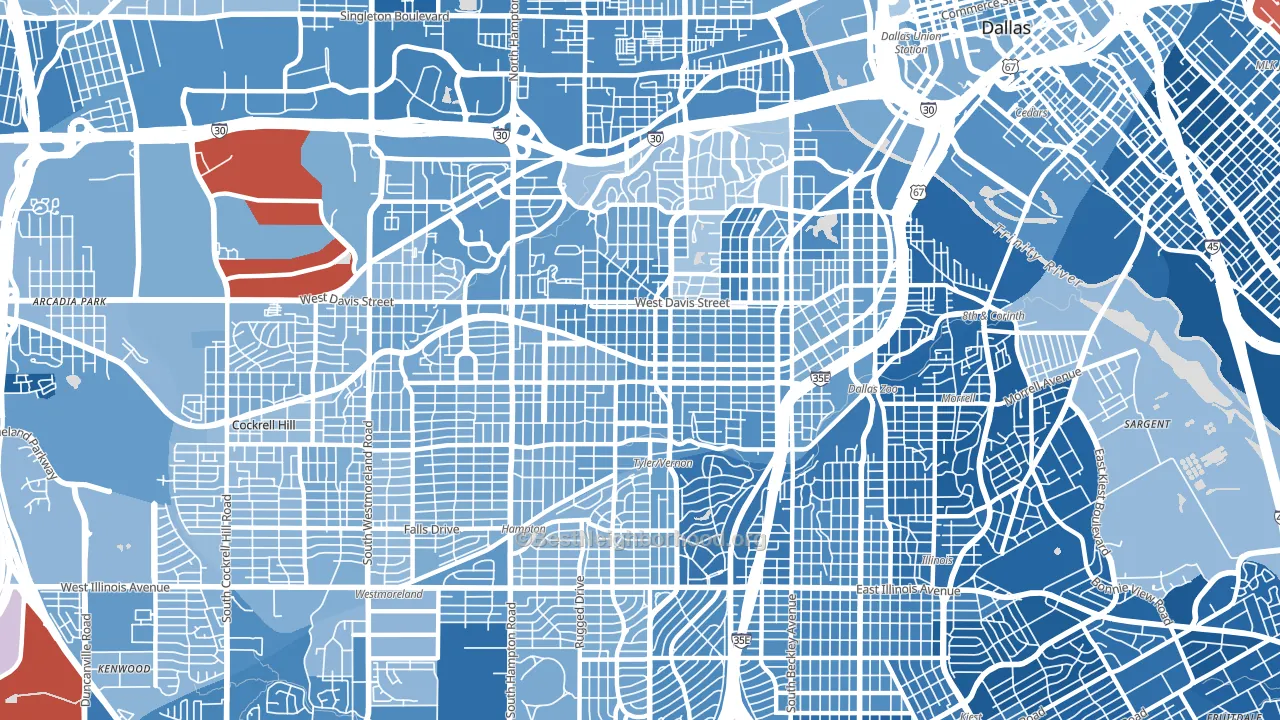
Oak Cliff leans heavily Democratic by roughly 38 points: about 69% of voters vote Democratic and 31% Republican.
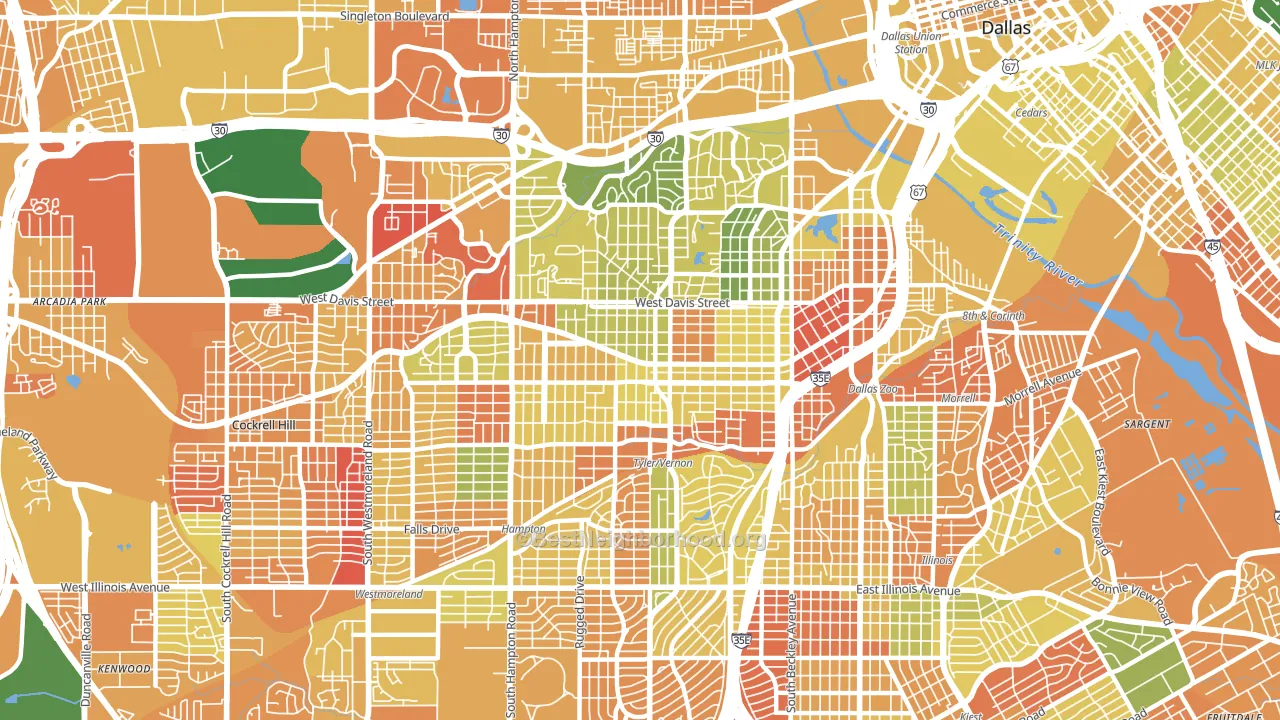
About 43% of adults in Oak Cliff typically vote, below the U.S. average of about 62%. Among adults in Oak Cliff, ~30% vote Democratic, ~13% Republican, and ~57% don't vote. The map below shows estimated turnout by block group.
How Oak Cliff compares
Among neighborhoods within 5 miles, Oak Cliff leans more Democratic than 3 of 8 neighbors.
Oak Cliff runs about 52 points more Democratic than Texas as a whole. Texas leans Republican overall, while Oak Cliff is one of the few Democratic-leaning pockets.
Politics vary noticeably by block within Oak Cliff. The northeast side is the most Democratic-leaning (D+43) and the southeast side is the least Democratic-leaning (D+33), a spread of about 10 points.
Why Oak Cliff leans the way it does
This analysis examined 14,881 data points per neighborhood to find what predicts political lean and turnout. The items below are a few correlations that stood out for Oak Cliff, not a ranked or complete list of what matters most.
Oak Cliff votes against the grain of Texas. Texas leans Republican overall, while Oak Cliff runs about 52 points more Democratic.
Preventive-care access and voter turnout
Places with limited routine preventive-care access tend to turn out at a lower rate; Oak Cliff, Dallas, TX sits in the bottom quarter nationally on this measure. Dental visits do not drive turnout; the rate reflects income, insurance, and healthcare access, which line up with who votes.
Why turnout in Oak Cliff looks the way it does
Areas with limited routine healthcare access turn out at lower rates. Oak Cliff is in the bottom quarter nationally for routine-care measures such as insurance coverage, preventive screenings, and dental visits. The uninsured rate here is about 29%, about 11 points above the Texas average of 19%. Learn more about the findings and methodology on the political spectrum map.
Nearby Neighborhoods
- Winnetka Heights, Dallas, TX D+36
- Eagle Ford, Dallas, TX D+47
- Five Mile Creek, Dallas, TX D+54
- Cedar Crest, Dallas, TX D+68
- Near East, Dallas, TX D+24
- West End Historic District, Dallas, TX D+33
- Farmers Market District, Dallas, TX D+51
- Southwest Dallas, Dallas, TX D+45
- Oak Lawn, Dallas, TX D+20
- South Boulevard Park Row, Dallas, TX D+68
Neighborhoods with Similar Populations
- Morningside Heights, Manhattan, NY D+76
- Norwood Park, Chicago, IL Even
- University, Columbus, OH D+56
- Pacific, Stockton, CA D+24
- Capitol Hill, Seattle, WA D+79
- Far West, Fort Worth, TX R+23
- Unionport, Bronx, NY D+39
- Bay Area, Corpus Christi, TX Even
- Far North, Columbus, OH D+26
- Richmondtown, Staten Island, NY R+41
Sources and methodology
Precinct-level voting records used to fit the model come from Texas Secretary of State, Elections Division, distributed by the Voting and Election Science Team. Demographic inputs come from the U.S. Census Bureau (ACS 5-year estimates and the 2020 Decennial Census). Health and environmental inputs come from the CDC (PLACES and the Environmental Justice Index). Land cover comes from the USGS and EPA. Election-day and lead-up weather come from PRISM 4km daily grids and the NOAA Global Historical Climatology Network. Mail-voting and election-administration patterns come from the MIT Election Lab's Survey of the Performance of American Elections. Block-group crime detail comes from CrimeGrade. Internet data and modeling support provided by ISPreports.org.
Modeling and analysis by the BestNeighborhood data science team. Full methodology and findings: political spectrum map.
Methodology reviewed by the BestNeighborhood data team. Last updated May 2026.