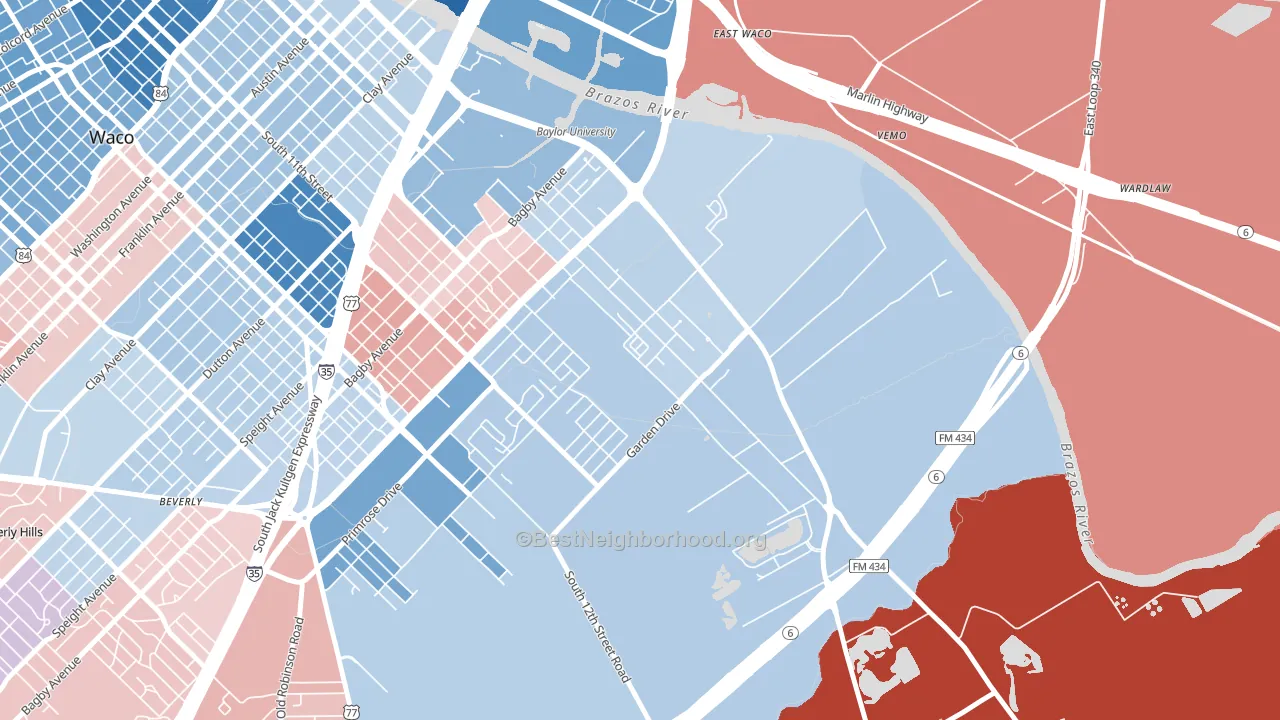
Oakwood is a true toss-up. About 51% of voters here vote Democratic and 49% Republican.
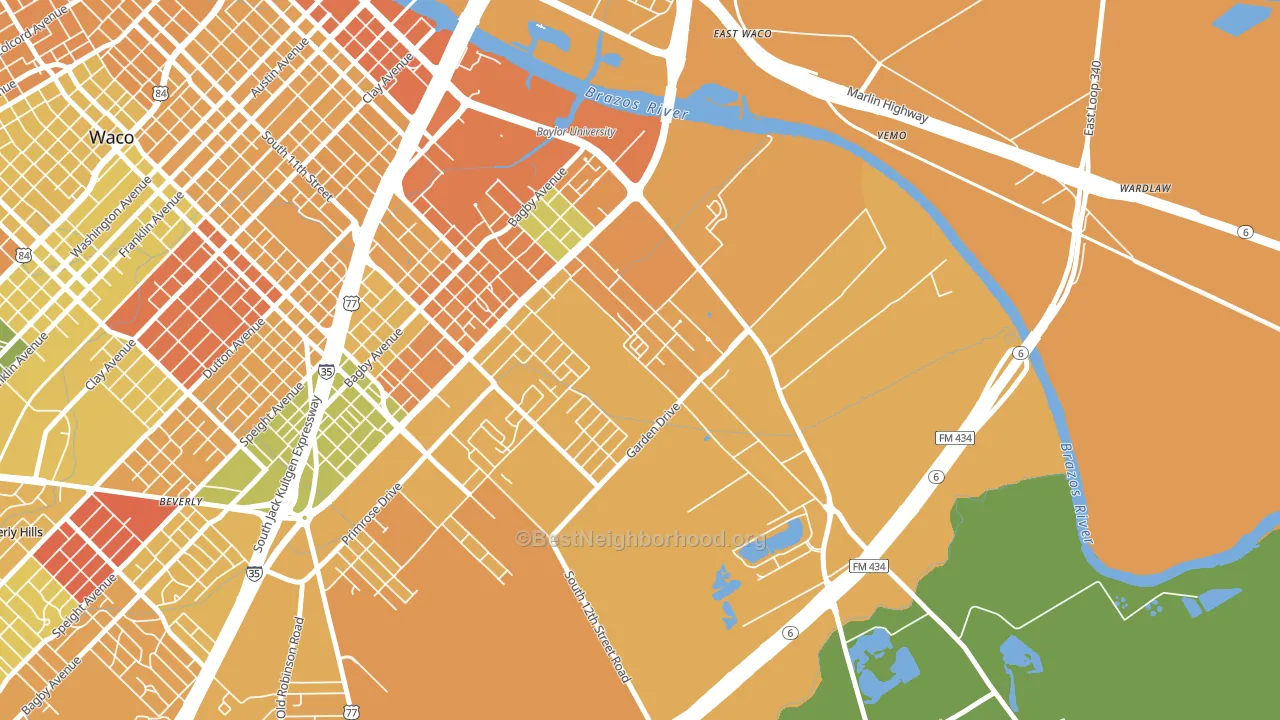
About 32% of adults in Oakwood typically vote, below the U.S. average of about 62%. Among adults in Oakwood, ~16% vote Democratic, ~16% Republican, and ~68% don't vote. The map below shows estimated turnout by block group.
How Oakwood compares
Among neighborhoods within 5 miles, Oakwood sits roughly in the middle of the political spectrum, with 1 neighbors leaning further in the place's direction and 7 leaning the other way.
Oakwood runs about 15 points more Democratic than Texas as a whole. Texas leans Republican overall, while Oakwood sits closer to the political middle.
Why Oakwood leans the way it does
This analysis examined 14,881 data points per neighborhood to find what predicts political lean and turnout. The items below are a few correlations that stood out for Oakwood, not a ranked or complete list of what matters most.
Oakwood votes against the grain of Texas. Texas leans Republican overall, while Oakwood runs about 15 points more Democratic.
Preventive-care access and voter turnout
Places with limited routine preventive-care access tend to turn out at a lower rate; Oakwood, Waco, TX sits in the bottom tenth nationally on this measure. Dental visits do not drive turnout; the rate reflects income, insurance, and healthcare access, which line up with who votes.
Why turnout in Oakwood looks the way it does
Areas with limited routine healthcare access turn out at lower rates. Oakwood is in the bottom quarter nationally for routine-care measures such as insurance coverage, preventive screenings, and dental visits. The dental-visit rate here is about 33%, about 20 points below the Texas average of 54%. Renters vote less often than owners, and about 86% of households in Oakwood rent, compared to around 56% in nearby neighborhoods. Learn more about the findings and methodology on the political spectrum map.
Nearby Neighborhoods
- Baylor, Waco, TX D+8
- University, Waco, TX D+15
- Alta Vista-Waco, Waco, TX Even
- Kendrick, Waco, TX D+2
- Brookview, Waco, TX D+6
- Carver, Waco, TX D+60
- North Waco, Waco, TX D+20
- Richland Hills, Waco, TX D+16
- Landon Branch, Waco, TX R+16
- Cedar Ridge, Waco, TX R+7
Neighborhoods with Similar Populations
- Southwestern Hills, Des Moines, IA D+18
- Tarrytown, Austin, TX D+27
- Saint Francis Wood, San Francisco, CA D+55
- Sans Souci, Jacksonville, FL R+14
- Waverley Square, Belmont, MA D+62
- Heritage Hill, Grand Rapids, MI D+61
- Southside, Binghamton, NY D+26
- North Kensington, Kensington, MD D+58
- View Ridge, Seattle, WA D+70
- Fairmont Park, Des Moines, IA D+7
Sources and methodology
Precinct-level voting records used to fit the model come from Texas Secretary of State, Elections Division, distributed by the Voting and Election Science Team. Demographic inputs come from the U.S. Census Bureau (ACS 5-year estimates and the 2020 Decennial Census). Health and environmental inputs come from the CDC (PLACES and the Environmental Justice Index). Land cover comes from the USGS and EPA. Election-day and lead-up weather come from PRISM 4km daily grids and the NOAA Global Historical Climatology Network. Mail-voting and election-administration patterns come from the MIT Election Lab's Survey of the Performance of American Elections. Block-group crime detail comes from CrimeGrade. Internet data and modeling support provided by ISPreports.org.
Modeling and analysis by the BestNeighborhood data science team. Full methodology and findings: political spectrum map.
Methodology reviewed by the BestNeighborhood data team. Last updated May 2026.