Saint Francis Wood is a Democratic stronghold. About 78% of voters here vote Democratic and 22% Republican.
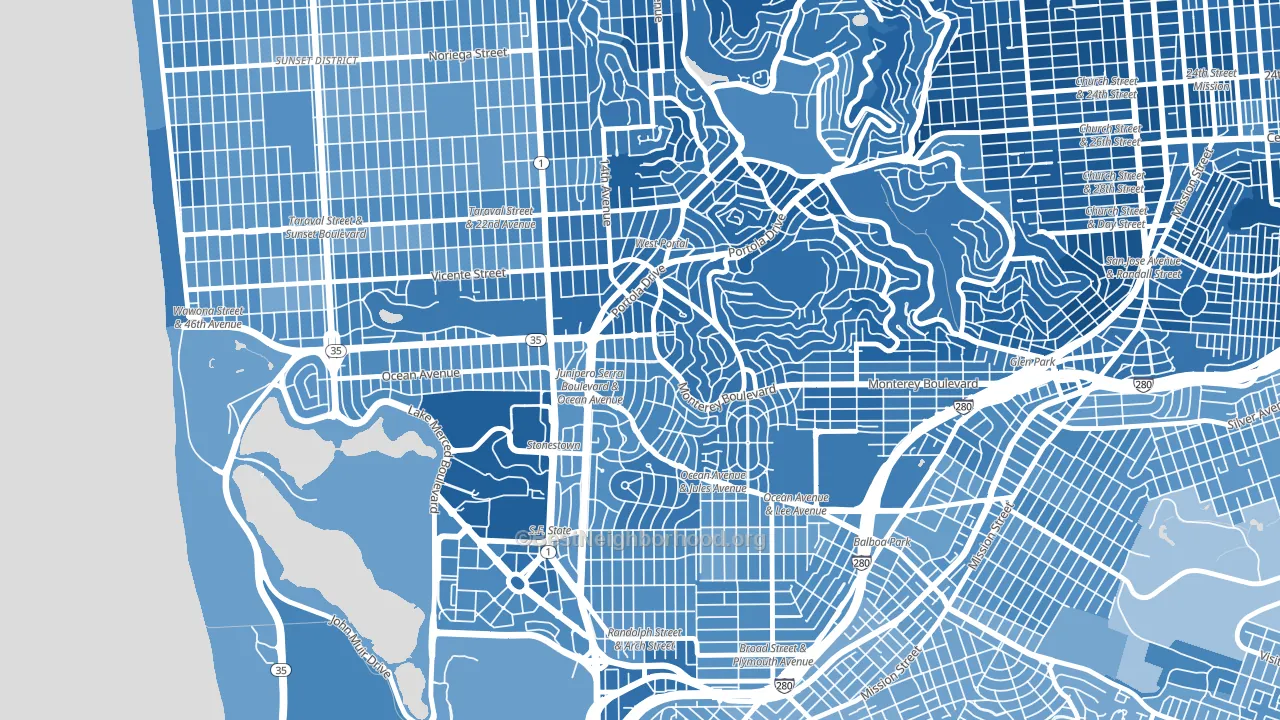
About 88% of adults in Saint Francis Wood typically vote, above the U.S. average of about 62%. Among adults in Saint Francis Wood, ~69% vote Democratic, ~19% Republican, and ~12% don't vote. The map below shows estimated turnout by block group.
How Saint Francis Wood compares
Among neighborhoods within 5 miles, Saint Francis Wood leans more Democratic than 17 of 43 neighbors.
Saint Francis Wood runs about 35 points more Democratic than California as a whole.
Politics vary noticeably by block within Saint Francis Wood. The north side is the most Democratic-leaning (D+61) and the west side is the least Democratic-leaning (D+43), a spread of about 19 points.
Why Saint Francis Wood leans the way it does
This analysis examined 14,881 data points per neighborhood to find what predicts political lean and turnout. The items below are a few correlations that stood out for Saint Francis Wood, not a ranked or complete list of what matters most.
Dense areas vote Democratic. More than 99% of residents in Saint Francis Wood live in densely developed areas, about 64 points above the U.S. average of 36%. High college attainment predicts Democratic voting, and Saint Francis Wood sits in the top quarter (about 73%, above 92% of neighborhoods).
Walkability and Democratic lean
Places with a highly walkable street grid tend to lean Democratic; Saint Francis Wood, San Francisco, CA sits in the top tenth nationally on this measure. A walkable street grid does not change how people vote; it mostly reflects how urban a place is.
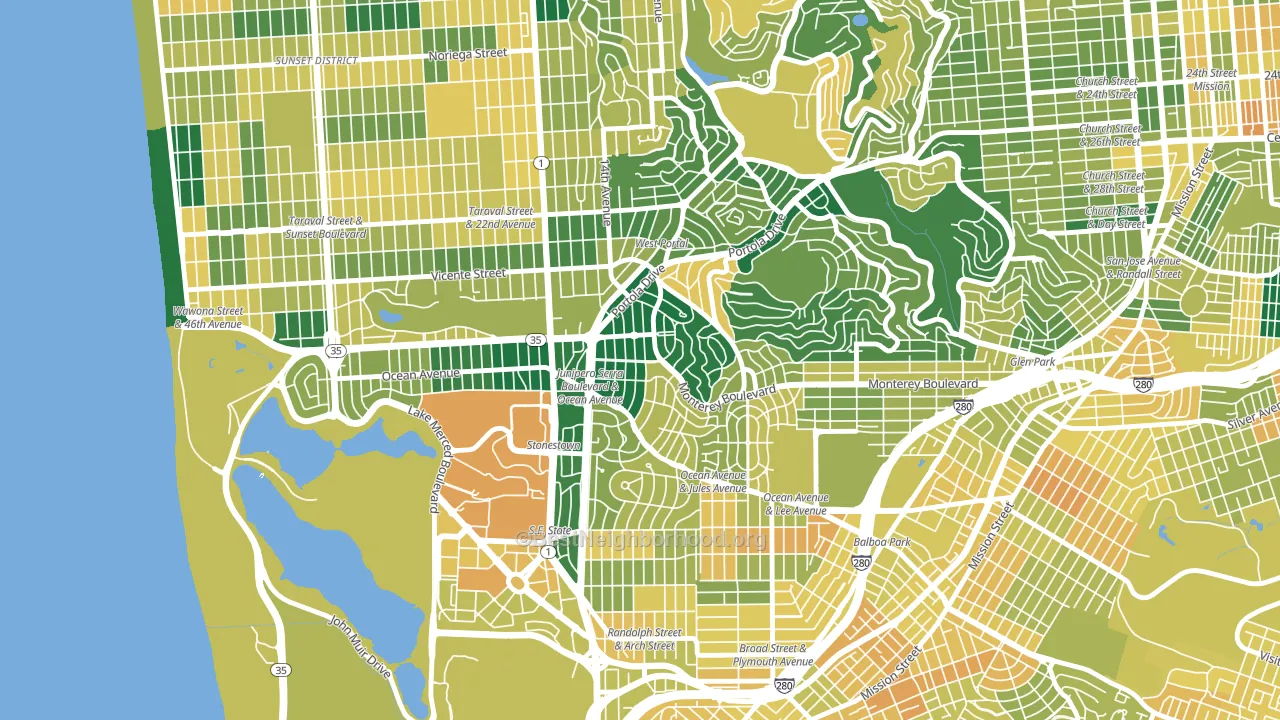
Why turnout in Saint Francis Wood looks the way it does
Areas with strong routine healthcare access turn out at higher rates. Saint Francis Wood is in the top quarter nationally for routine-care measures such as insurance coverage, preventive screenings, and dental visits. The dental-visit rate here is about 71%, about 11 points above the U.S. average of 60%. Homeowners vote more often than renters, and about 90% of households in Saint Francis Wood own their home, compared to around 62% in nearby neighborhoods. Learn more about the findings and methodology on the political spectrum map.
Nearby Neighborhoods
- West of Twin Peaks, San Francisco, CA D+62
- Lakeshore, San Francisco, CA D+49
- Ingleside, San Francisco, CA D+50
- Ocean View, San Francisco, CA D+45
- Parkside, San Francisco, CA D+48
- Outer Mission, San Francisco, CA D+48
- Twin Peaks, San Francisco, CA D+67
- Diamond Heights, San Francisco, CA D+71
- Inner Sunset, San Francisco, CA D+72
- Glen Park, San Francisco, CA D+79
Neighborhoods with Similar Populations
- Oakwood, Waco, TX Even
- North Kensington, Kensington, MD D+58
- Southwestern Hills, Des Moines, IA D+18
- View Ridge, Seattle, WA D+70
- Tarrytown, Austin, TX D+27
- Sans Souci, Jacksonville, FL R+14
- Waverley Square, Belmont, MA D+62
- Heritage Hill, Grand Rapids, MI D+61
- Southside, Binghamton, NY D+26
- Five Points, Great Lakes, IL D+42
Sources and methodology
Precinct-level voting records used to fit the model come from California Secretary of State, Elections, distributed by the Voting and Election Science Team. Demographic inputs come from the U.S. Census Bureau (ACS 5-year estimates and the 2020 Decennial Census). Health and environmental inputs come from the CDC (PLACES and the Environmental Justice Index). Land cover comes from the USGS and EPA. Election-day and lead-up weather come from PRISM 4km daily grids and the NOAA Global Historical Climatology Network. Mail-voting and election-administration patterns come from the MIT Election Lab's Survey of the Performance of American Elections. Block-group crime detail comes from CrimeGrade. Internet data and modeling support provided by ISPreports.org.
Modeling and analysis by the BestNeighborhood data science team. Full methodology and findings: political spectrum map.
Methodology reviewed by the BestNeighborhood data team. Last updated May 2026.