Ochiltree County is a Republican stronghold. About 21% of voters here vote Democratic and 79% Republican.
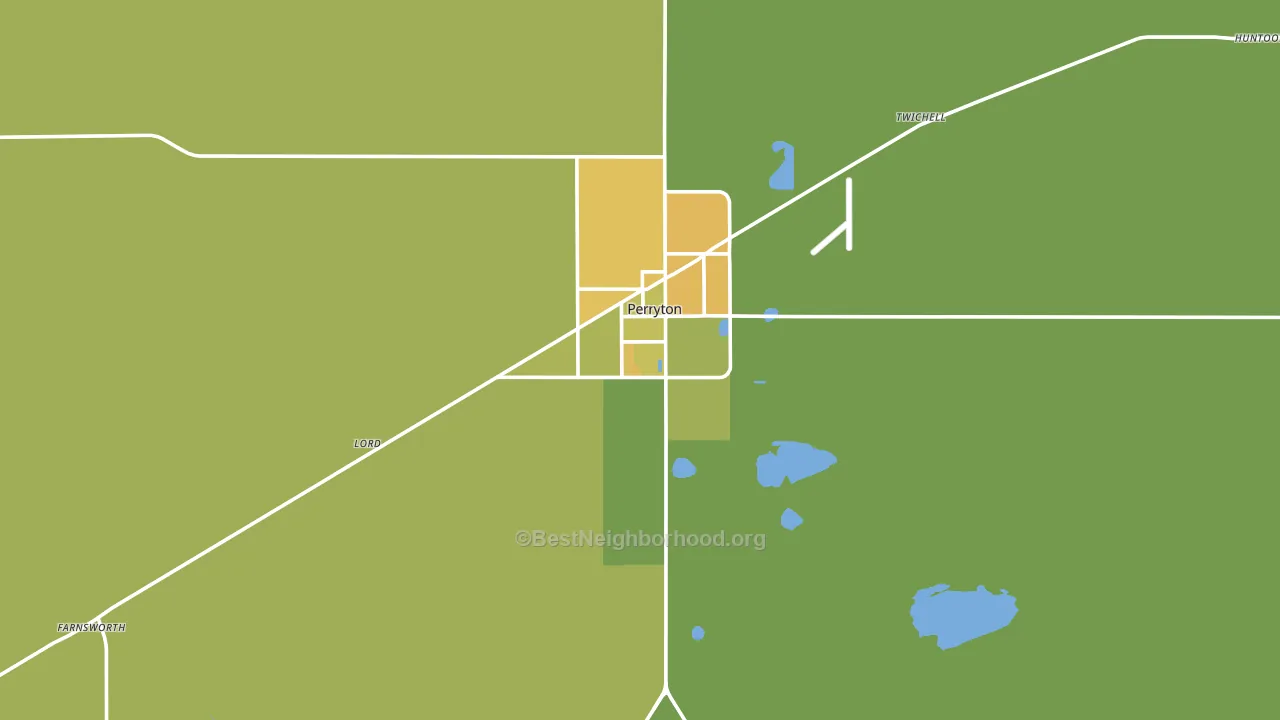
About 60% of adults in Ochiltree County typically vote, near the U.S. average of about 62%. Among adults in Ochiltree County, ~13% vote Democratic, ~47% Republican, and ~40% don't vote. The map below shows estimated turnout by block group.
How Ochiltree County compares
Among counties within 50 miles, Ochiltree County leans more Republican than 2 of 7 neighbors.
Ochiltree County runs about 44 points more Republican than Texas as a whole.
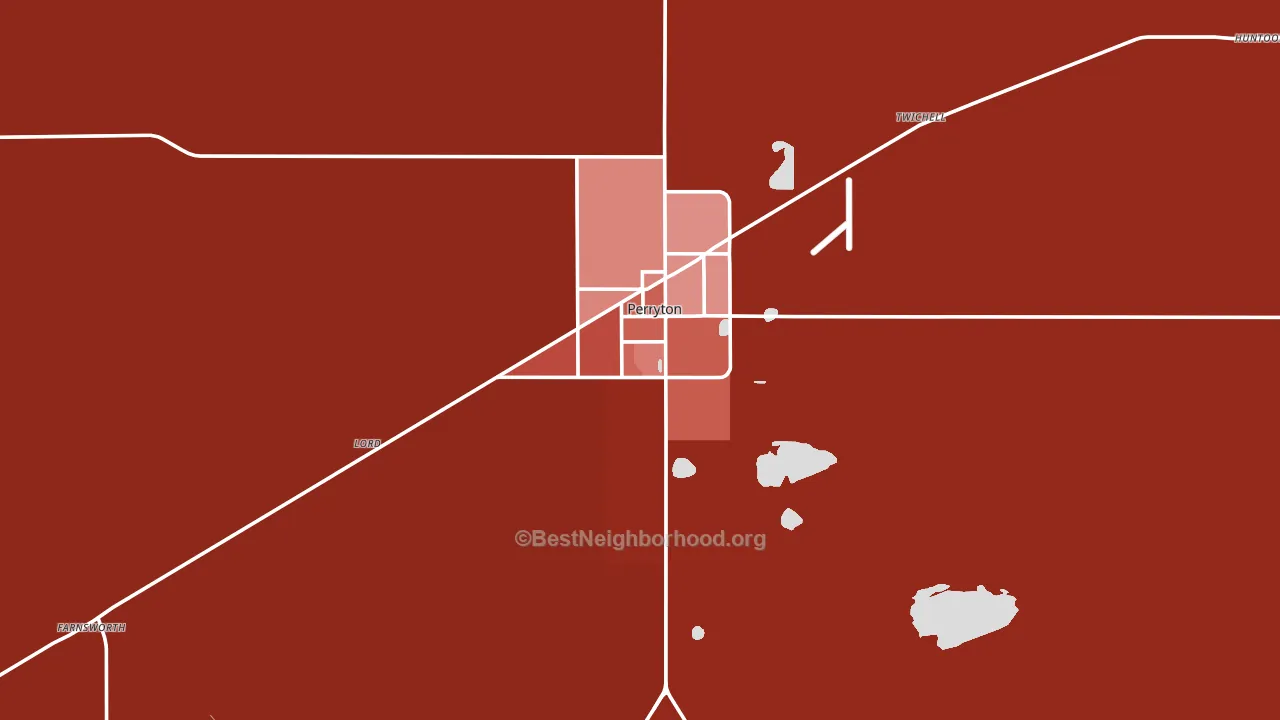
Politics vary noticeably by city within Ochiltree County. The southwest side is the most Republican-leaning (R+89) and the north side is the least Republican-leaning (R+46), a spread of about 44 points.
Why Ochiltree County leans the way it does
This analysis examined 14,881 data points per county to find what predicts political lean and turnout. The items below are a few correlations that stood out for Ochiltree County, not a ranked or complete list of what matters most.
Ochiltree County votes Republican even though it is densely developed (about 61%, well above the Texas average of 35%). State and regional patterns outweigh the Democratic lean that density usually predicts here.
Cancer-screening access and voter turnout
Places with low colon-cancer-screening access tend to turn out at a lower rate; Ochiltree County, TX sits in the bottom tenth nationally on this measure. Cancer screening does not drive turnout; it reflects income, insurance, and healthcare access.
Why turnout in Ochiltree County looks the way it does
Areas with limited routine healthcare access turn out at lower rates. Ochiltree County is in the bottom quarter nationally for routine-care measures such as insurance coverage, preventive screenings, and dental visits. The uninsured rate here is about 25%, about 7 points above the Texas average of 19%. Learn more about the findings and methodology on the political spectrum map.
Nearby Counties
- Lipscomb County, TX R+84
- Hansford County, TX R+68
- Beaver County, OK R+77
- Hemphill County, TX R+66
- Texas County, OK R+45
- Roberts County, TX R+90
- Seward County, KS R+27
- Ellis County, OK R+77
- Gray County, TX R+59
- Hutchinson County, TX R+60
Counties with Similar Populations
- Madison Parish, LA D+6
- Perry County, AR R+62
- Franklin County, IA R+43
- Lewis County, MO R+59
- Carroll County, MS R+40
- Keokuk County, IA R+47
- Marshall County, KS R+53
- Jackson County, MN R+42
- Yuma County, CO R+60
- Nome Census Area, AK D+23
Sources and methodology
Precinct-level voting records used to fit the model come from Texas Secretary of State, Elections Division, distributed by the Voting and Election Science Team. Demographic inputs come from the U.S. Census Bureau (ACS 5-year estimates and the 2020 Decennial Census). Health and environmental inputs come from the CDC (PLACES and the Environmental Justice Index). Land cover comes from the USGS and EPA. Election-day and lead-up weather come from PRISM 4km daily grids and the NOAA Global Historical Climatology Network. Mail-voting and election-administration patterns come from the MIT Election Lab's Survey of the Performance of American Elections. Block-group crime detail comes from CrimeGrade. Internet data and modeling support provided by ISPreports.org.
Modeling and analysis by the BestNeighborhood data science team. Full methodology and findings: political spectrum map.
Methodology reviewed by the BestNeighborhood data team. Last updated May 2026.