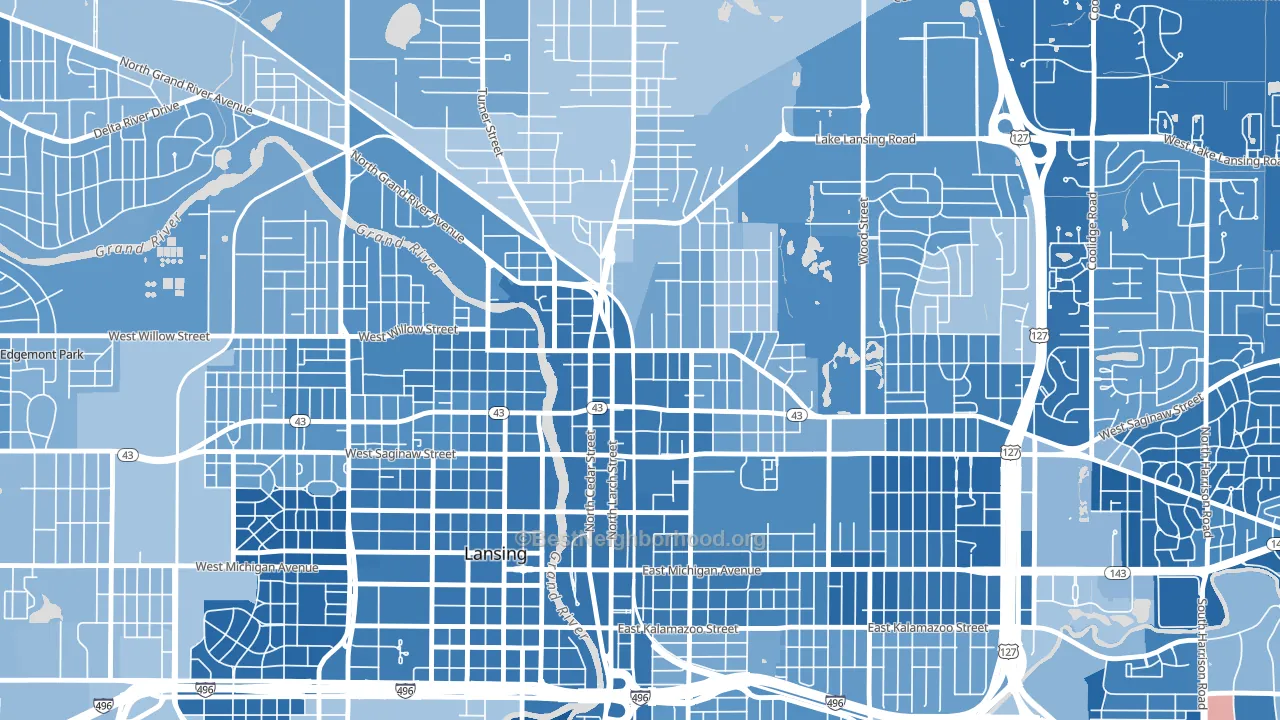
Old Town leans heavily Democratic by roughly 48 points: about 74% of voters vote Democratic and 26% Republican.
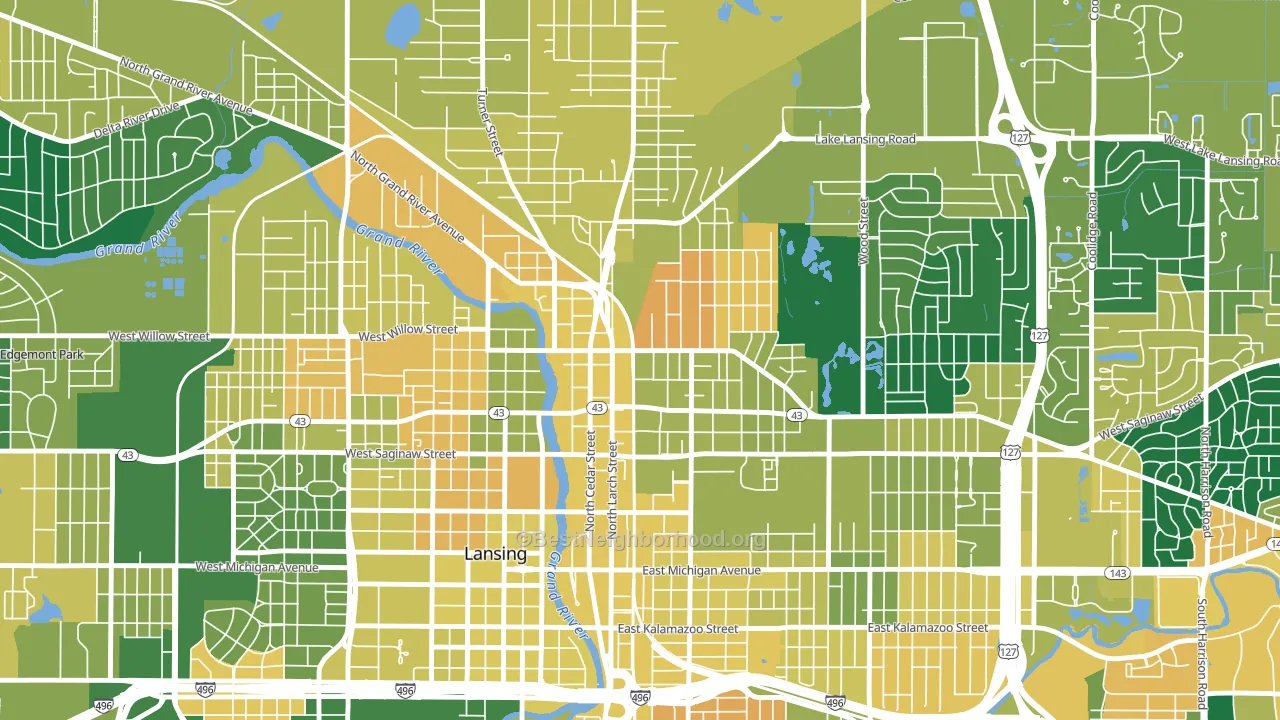
About 57% of adults in Old Town typically vote, near the U.S. average of about 62%. Among adults in Old Town, ~42% vote Democratic, ~15% Republican, and ~43% don't vote. The map below shows estimated turnout by block group.
How Old Town compares
Among neighborhoods within 5 miles, Old Town leans more Democratic than 4 of 8 neighbors.
Old Town runs about 49 points more Democratic than Michigan as a whole. Michigan is roughly evenly split, and Old Town sits clearly on the Democratic side.
Politics vary noticeably by block within Old Town. The south side is the most Democratic-leaning (D+61) and the northeast side is the least Democratic-leaning (D+33), a spread of about 28 points.
Why Old Town leans the way it does
This analysis examined 14,881 data points per neighborhood to find what predicts political lean and turnout. The items below are a few correlations that stood out for Old Town, not a ranked or complete list of what matters most.
Old Town votes against the grain of Michigan. Michigan is roughly evenly split, while Old Town runs about 49 points more Democratic. A high never-married share predicts Democratic voting, and about 53% of adults in Old Town have never been married, above 86% of neighborhoods.
Paved land cover and Democratic lean
Places with extensive paved surfaces tend to lean Democratic; Old Town, Lansing, MI sits in the top quarter nationally on this measure. Paved ground does not change how people vote; it mostly reflects how urban and built-up a place is.
Why turnout in Old Town looks the way it does
Renters vote less often than owners. About 65% of households in Old Town rent, about 40 points above the U.S. average of 25%. High food insecurity lines up with lower turnout, and about 30% of adults in Old Town report food insecurity, above 83% of neighborhoods. High-crime urban areas turn out at lower rates, and Old Town sits in the top 15% on a violent-crime measure. Learn more about the findings and methodology on the political spectrum map.
Nearby Neighborhoods
- Downtown Lansing, Lansing, MI D+57
- Eastside Lansing, Lansing, MI D+45
- Westside Lansing, Lansing, MI D+54
- Northwestside, Lansing, MI D+36
- Old Everett, Lansing, MI D+33
- Bailey, East Lansing, MI D+57
- Forest View, Lansing, MI D+54
- Southside, Lansing, MI D+38
- Downtown Village of Holly, Holly, MI R+14
- Abbot, Ann Arbor, MI D+60
Neighborhoods with Similar Populations
- Bellemeade, Richmond, VA D+82
- Chatham Parkway, Savannah, GA D+42
- South Walker, Oklahoma City, OK D+10
- Edgemoor, St. Petersburg, FL Even
- Huckleberry Fields, Alafaya, FL Even
- South Plaza, Kansas City, MO D+51
- Riverview Park, Tulsa, OK D+41
- Highland Park, Birmingham, AL D+36
- Aurora-Butteville-Barlow, Canby, OR D+14
- Woodland Edge, Little Rock, AR D+17
Sources and methodology
Precinct-level voting records used to fit the model come from Michigan Department of State, Elections, distributed by the Voting and Election Science Team. Demographic inputs come from the U.S. Census Bureau (ACS 5-year estimates and the 2020 Decennial Census). Health and environmental inputs come from the CDC (PLACES and the Environmental Justice Index). Land cover comes from the USGS and EPA. Election-day and lead-up weather come from PRISM 4km daily grids and the NOAA Global Historical Climatology Network. Mail-voting and election-administration patterns come from the MIT Election Lab's Survey of the Performance of American Elections. Block-group crime detail comes from CrimeGrade. Internet data and modeling support provided by ISPreports.org.
Modeling and analysis by the BestNeighborhood data science team. Full methodology and findings: political spectrum map.
Methodology reviewed by the BestNeighborhood data team. Last updated May 2026.