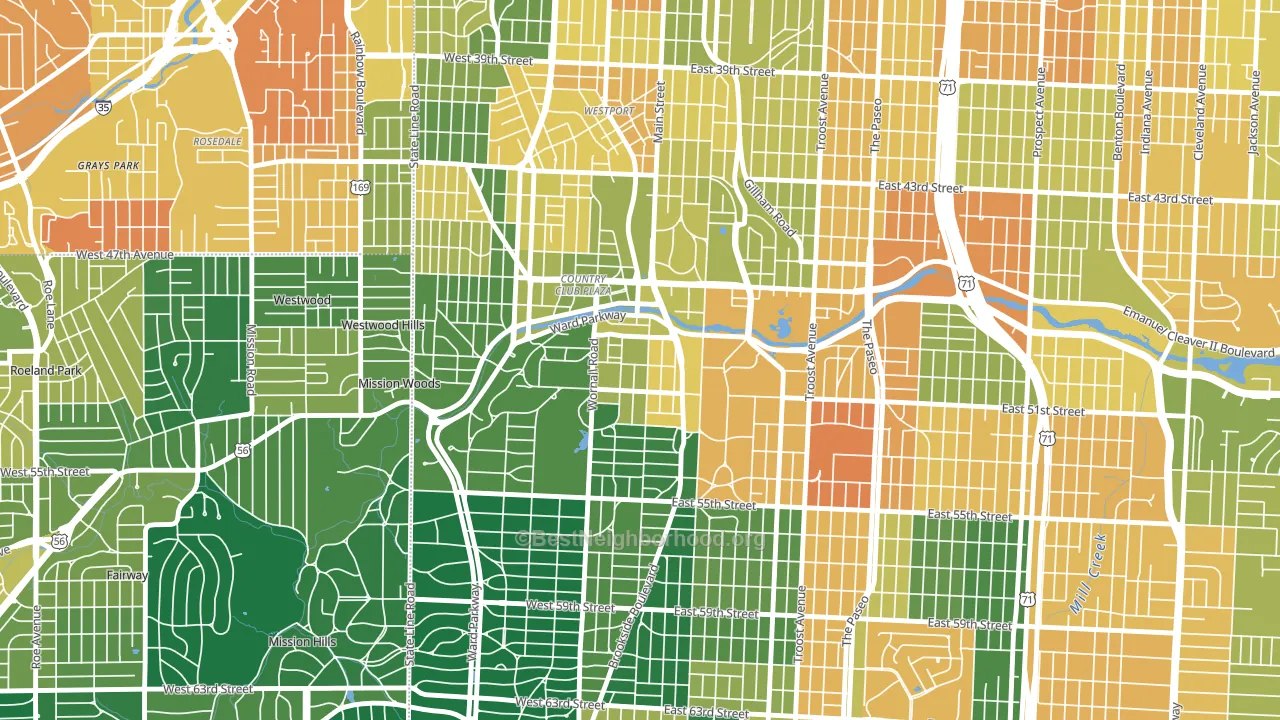
South Plaza is a Democratic stronghold. About 76% of voters here vote Democratic and 24% Republican.
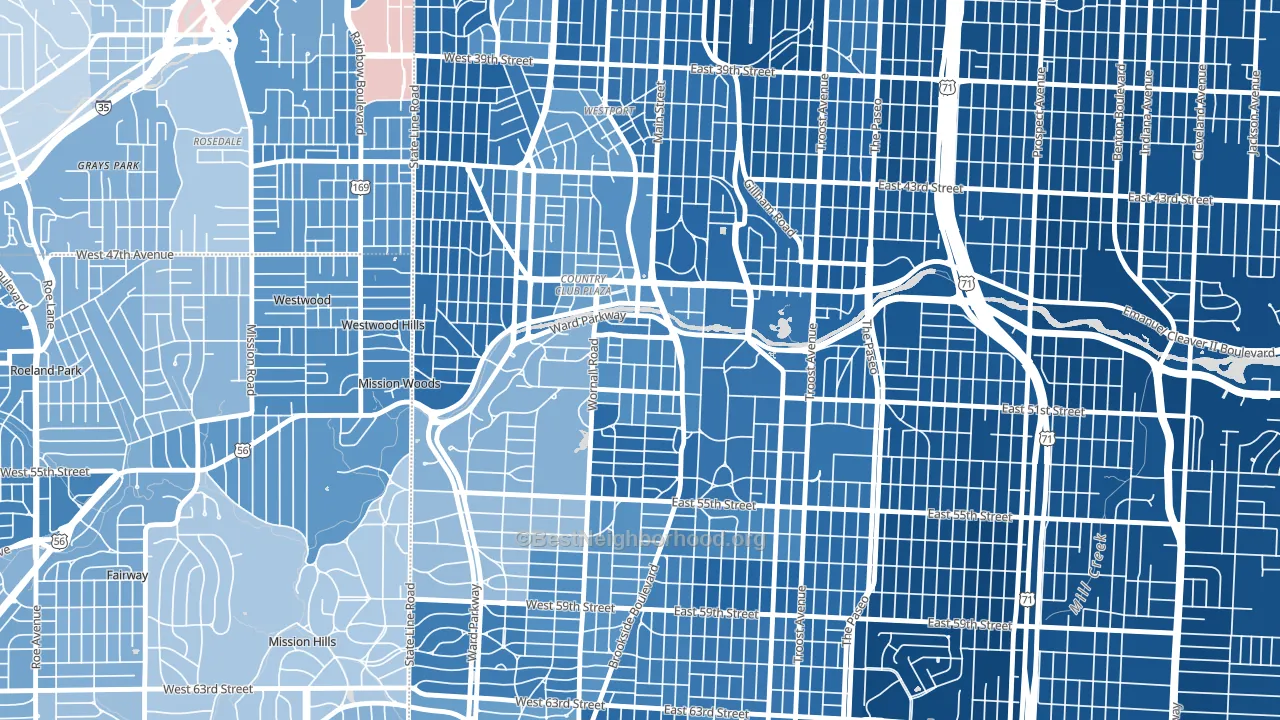
About 57% of adults in South Plaza typically vote, near the U.S. average of about 62%. Among adults in South Plaza, ~43% vote Democratic, ~14% Republican, and ~43% don't vote. The map below shows estimated turnout by block group.
How South Plaza compares
Among neighborhoods within 5 miles, South Plaza leans more Democratic than 3 of 19 neighbors.
South Plaza runs about 70 points more Democratic than Missouri as a whole. Missouri leans Republican overall, while South Plaza is one of the few Democratic-leaning pockets.
Why South Plaza leans the way it does
This analysis examined 14,881 data points per neighborhood to find what predicts political lean and turnout. The items below are a few correlations that stood out for South Plaza, not a ranked or complete list of what matters most.
Areas with high college attainment vote Democratic. About 82% of adults in South Plaza hold a bachelor's degree, about 54 points above the U.S. average of 28%. Dense areas vote Democratic, and South Plaza sits in the top fifth on density (more than 99%, above 89% of neighborhoods). South Plaza runs against the grain of Missouri, a Democratic-leaning pocket in a Republican-leaning state.
Paved land cover and Democratic lean
Places with extensive paved surfaces tend to lean Democratic; South Plaza, Kansas City, MO sits in the top tenth nationally on this measure. Paved ground does not change how people vote; it mostly reflects how urban and built-up a place is.
Why turnout in South Plaza looks the way it does
Strong routine healthcare access lines up with higher turnout, and South Plaza sits in the top quarter on routine-care measures. Learn more about the findings and methodology on the political spectrum map.
Nearby Neighborhoods
- West Plaza, Kansas City, MO D+56
- Southmoreland, Kansas City, MO D+70
- Western 49-63, Kansas City, MO D+64
- Eastern 49-63, Kansas City, MO D+72
- Blue Hills, Kansas City, MO D+83
- Volker, Kansas City, MO D+66
- Rosedale, Kansas City, KS D+38
- North Town Fork Creek, Kansas City, MO D+84
- Oak Park Northwest, Kansas City, MO D+83
- Blenheim Square, Kansas City, MO D+79
Neighborhoods with Similar Populations
- Riverview Park, Tulsa, OK D+41
- Highland Park, Birmingham, AL D+36
- Aurora-Butteville-Barlow, Canby, OR D+14
- South Walker, Oklahoma City, OK D+10
- Chatham Parkway, Savannah, GA D+42
- Ridgewood, Springfield, OH R+4
- Edgemoor, St. Petersburg, FL Even
- Old Town, Lansing, MI D+47
- Bellemeade, Richmond, VA D+82
- San Miguel Ranch, Chula Vista, CA D+11
Sources and methodology
Precinct-level voting records used to fit the model come from Missouri Secretary of State, Elections, distributed by the Voting and Election Science Team. Demographic inputs come from the U.S. Census Bureau (ACS 5-year estimates and the 2020 Decennial Census). Health and environmental inputs come from the CDC (PLACES and the Environmental Justice Index). Land cover comes from the USGS and EPA. Election-day and lead-up weather come from PRISM 4km daily grids and the NOAA Global Historical Climatology Network. Mail-voting and election-administration patterns come from the MIT Election Lab's Survey of the Performance of American Elections. Block-group crime detail comes from CrimeGrade. Internet data and modeling support provided by ISPreports.org.
Modeling and analysis by the BestNeighborhood data science team. Full methodology and findings: political spectrum map.
Methodology reviewed by the BestNeighborhood data team. Last updated May 2026.