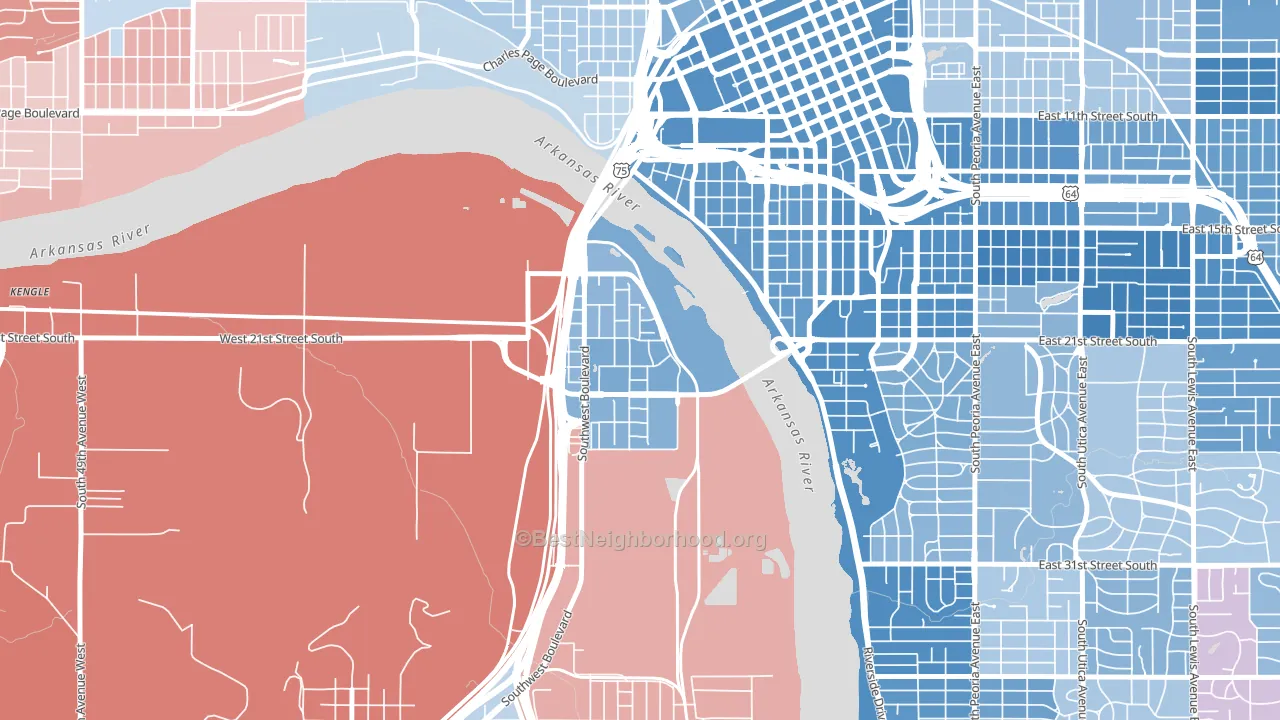
Riverview Park leans heavily Democratic by roughly 42 points: about 71% of voters vote Democratic and 29% Republican.
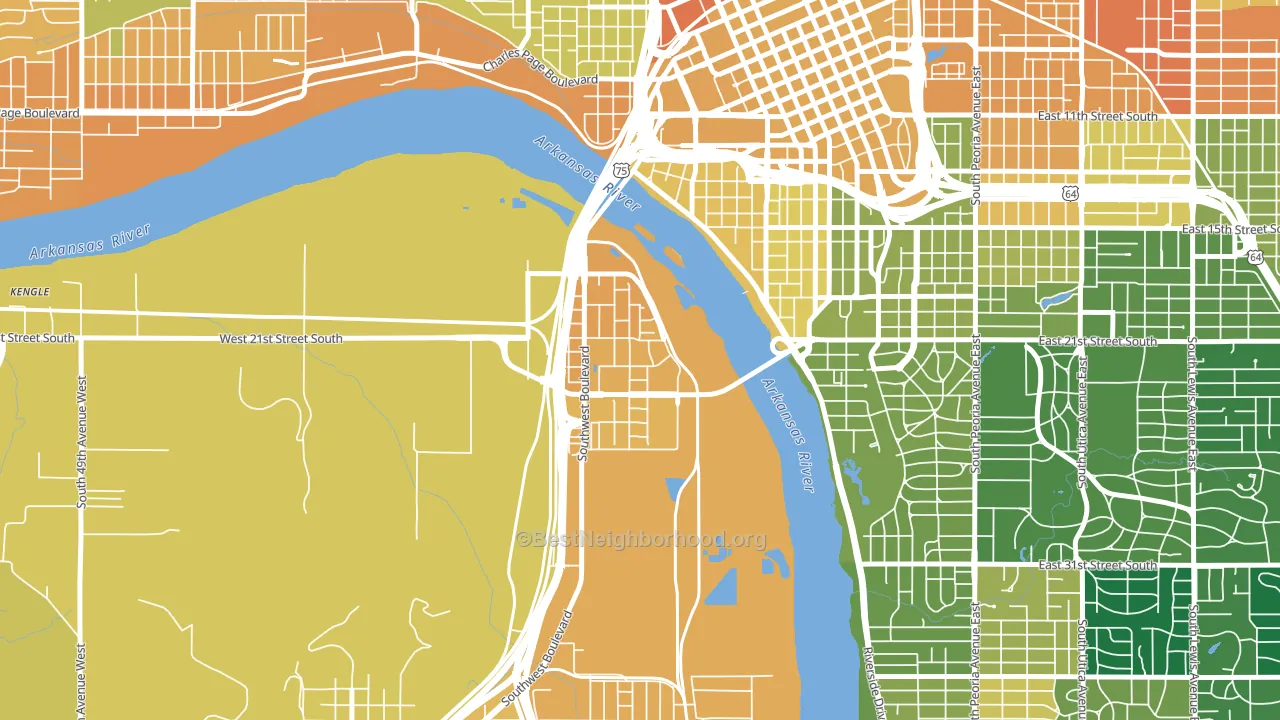
About 33% of adults in Riverview Park typically vote, below the U.S. average of about 62%. Among adults in Riverview Park, ~23% vote Democratic, ~10% Republican, and ~67% don't vote. The map below shows estimated turnout by block group.
How Riverview Park compares
Among neighborhoods within 5 miles, Riverview Park leans more Democratic than 8 of 10 neighbors.
Riverview Park runs about 90 points more Democratic than Oklahoma as a whole. Oklahoma leans Republican overall, while Riverview Park is one of the few Democratic-leaning pockets.
Why Riverview Park leans the way it does
This analysis examined 14,881 data points per neighborhood to find what predicts political lean and turnout. The items below are a few correlations that stood out for Riverview Park, not a ranked or complete list of what matters most.
Riverview Park votes against the grain of Oklahoma. Oklahoma leans Republican overall, while Riverview Park runs about 90 points more Democratic. A high never-married share predicts Democratic voting, and about 51% of adults in Riverview Park have never been married, above 83% of neighborhoods.
Walkability and Democratic lean
Places with a highly walkable street grid tend to lean Democratic; Riverview Park, Tulsa, OK sits in the top quarter nationally on this measure. A walkable street grid does not change how people vote; it mostly reflects how urban a place is.
Why turnout in Riverview Park looks the way it does
Renters vote less often than owners. About 87% of households in Riverview Park rent, about 63 points above the U.S. average of 25%. Limited routine healthcare access lines up with lower turnout, and Riverview Park sits in the bottom quarter on routine-care measures. High-crime urban areas turn out at lower rates, and Riverview Park sits in the top 15% on a violent-crime measure. Learn more about the findings and methodology on the political spectrum map.
Nearby Neighborhoods
- Downtown Tulsa, Tulsa, OK D+44
- Brookside, Tulsa, OK D+16
- Charles Page, Tulsa, OK R+12
- Gilcrease Hills, Tulsa, OK D+76
- Heller Park, Tulsa, OK D+19
- South Peoria, Tulsa, OK D+28
- Turner Park, Tulsa, OK D+19
- Springdale, Tulsa, OK D+21
- Mayo Meadow, Tulsa, OK D+18
- Sequoyah, Tulsa, OK D+11
Neighborhoods with Similar Populations
- South Plaza, Kansas City, MO D+51
- Aurora-Butteville-Barlow, Canby, OR D+14
- Highland Park, Birmingham, AL D+36
- South Walker, Oklahoma City, OK D+10
- Ridgewood, Springfield, OH R+4
- Bellemeade, Richmond, VA D+82
- Old Town, Lansing, MI D+47
- Edgemoor, St. Petersburg, FL Even
- Chatham Parkway, Savannah, GA D+42
- San Miguel Ranch, Chula Vista, CA D+11
Sources and methodology
Precinct-level voting records used to fit the model come from Oklahoma State Election Board, distributed by the Voting and Election Science Team. Demographic inputs come from the U.S. Census Bureau (ACS 5-year estimates and the 2020 Decennial Census). Health and environmental inputs come from the CDC (PLACES and the Environmental Justice Index). Land cover comes from the USGS and EPA. Election-day and lead-up weather come from PRISM 4km daily grids and the NOAA Global Historical Climatology Network. Mail-voting and election-administration patterns come from the MIT Election Lab's Survey of the Performance of American Elections. Block-group crime detail comes from CrimeGrade. Internet data and modeling support provided by ISPreports.org.
Modeling and analysis by the BestNeighborhood data science team. Full methodology and findings: political spectrum map.
Methodology reviewed by the BestNeighborhood data team. Last updated May 2026.