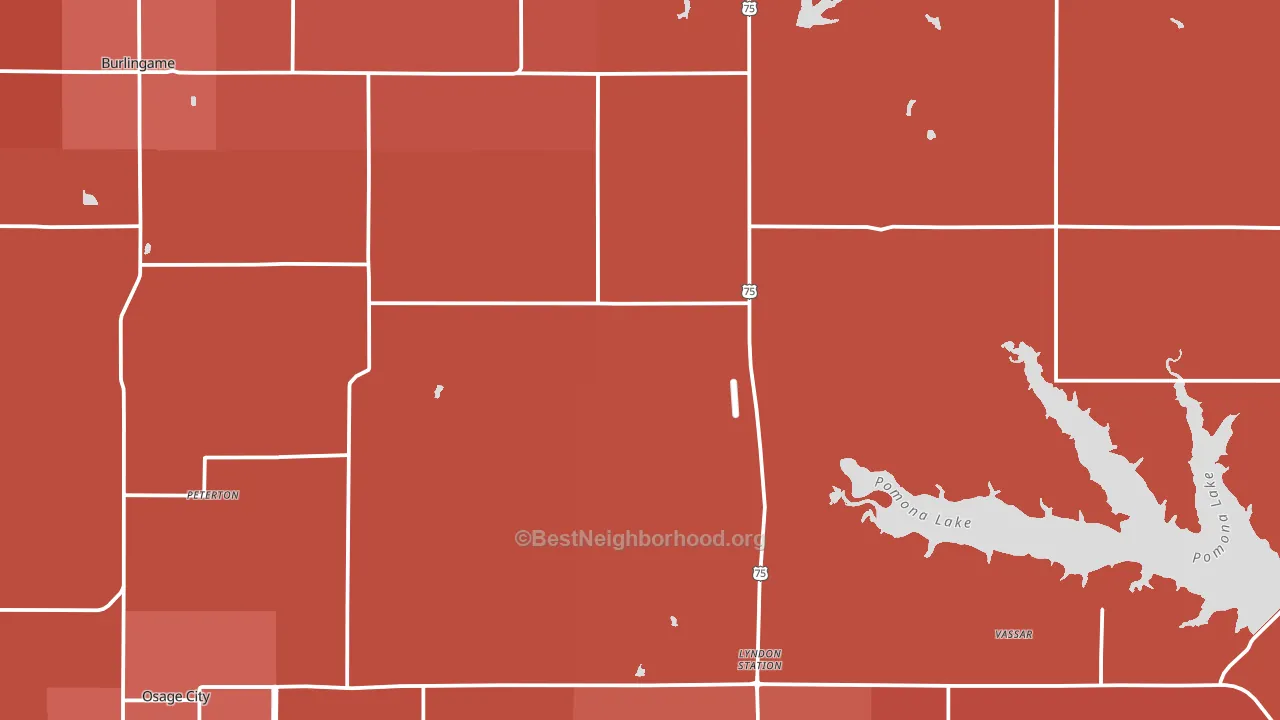
Osage County leans heavily Republican by roughly 48 points: about 26% of voters vote Democratic and 74% Republican.
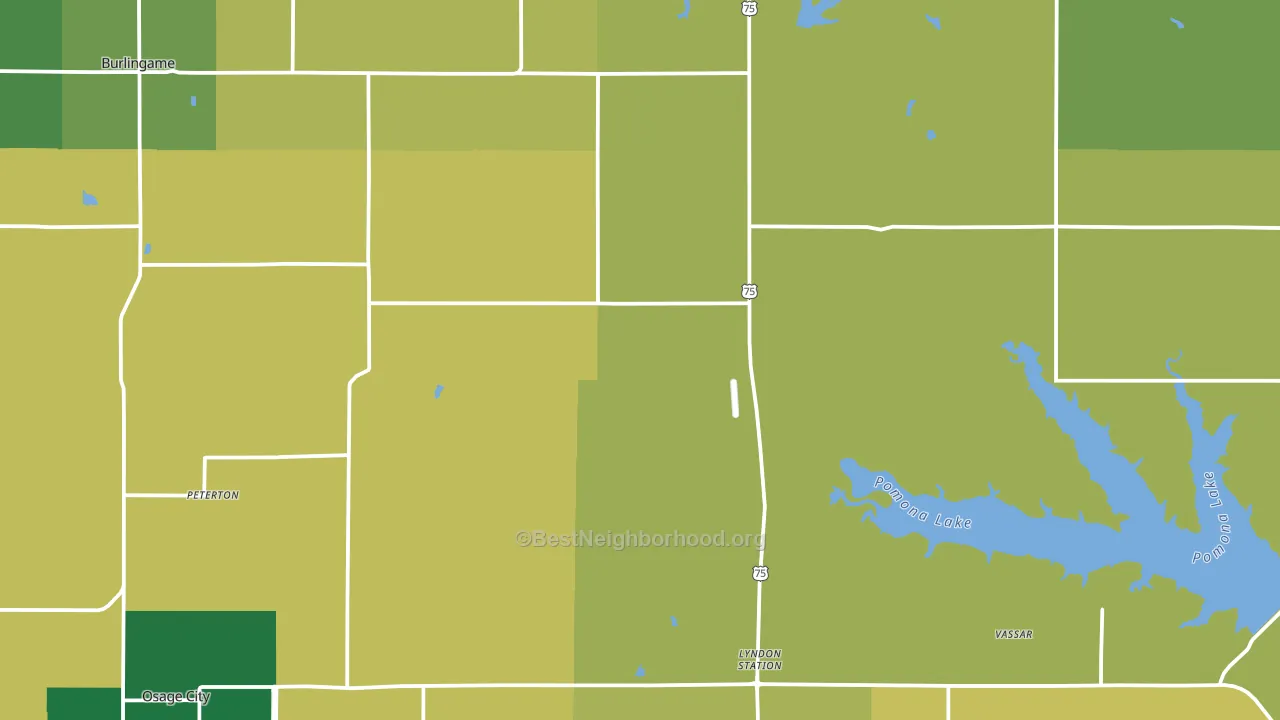
About 82% of adults in Osage County typically vote, above the U.S. average of about 62%. Among adults in Osage County, ~21% vote Democratic, ~61% Republican, and ~18% don't vote. The map below shows estimated turnout by block group.
How Osage County compares
Among counties within 50 miles, Osage County leans more Republican than 6 of 11 neighbors.
Osage County runs about 33 points more Republican than Kansas as a whole.
Why Osage County leans the way it does
Density, race composition, education, and family structure all sit close to their national averages in Osage County. The lean here lands roughly where demographic data alone would predict.
Population density and Republican lean
Places with low population density tend to lean Republican; Osage County, KS sits below the national average on this measure.
Why turnout in Osage County looks the way it does
Homeowners vote more often than renters. About 83% of households in Osage County own their home, about 8 points above the U.S. average of 75%. High high-school completion lines up with higher turnout, and about 94% of adults in Osage County have completed high school, above 82% of counties. Learn more about the findings and methodology on the political spectrum map.
Nearby Counties
- Shawnee County, KS D+4
- Franklin County, KS R+44
- Douglas County, KS D+35
- Coffey County, KS R+58
- Lyon County, KS R+14
- Wabaunsee County, KS R+53
- Jefferson County, KS R+50
- Anderson County, KS R+58
- Morris County, KS R+52
- Miami County, KS R+39
Counties with Similar Populations
- Van Buren County, AR R+63
- Richland County, IL R+50
- Leon County, TX R+69
- Grand County, CO R+6
- Jefferson County, GA D+5
- Sequatchie County, TN R+68
- Carroll County, IL R+34
- Mercer County, IL R+33
- Aitkin County, MN R+33
- Sevier County, AR R+50
Sources and methodology
Precinct-level voting records used to fit the model come from Kansas Secretary of State, Elections, distributed by the Voting and Election Science Team. Demographic inputs come from the U.S. Census Bureau (ACS 5-year estimates and the 2020 Decennial Census). Health and environmental inputs come from the CDC (PLACES and the Environmental Justice Index). Land cover comes from the USGS and EPA. Election-day and lead-up weather come from PRISM 4km daily grids and the NOAA Global Historical Climatology Network. Mail-voting and election-administration patterns come from the MIT Election Lab's Survey of the Performance of American Elections. Block-group crime detail comes from CrimeGrade. Internet data and modeling support provided by ISPreports.org.
Modeling and analysis by the BestNeighborhood data science team. Full methodology and findings: political spectrum map.
Methodology reviewed by the BestNeighborhood data team. Last updated May 2026.