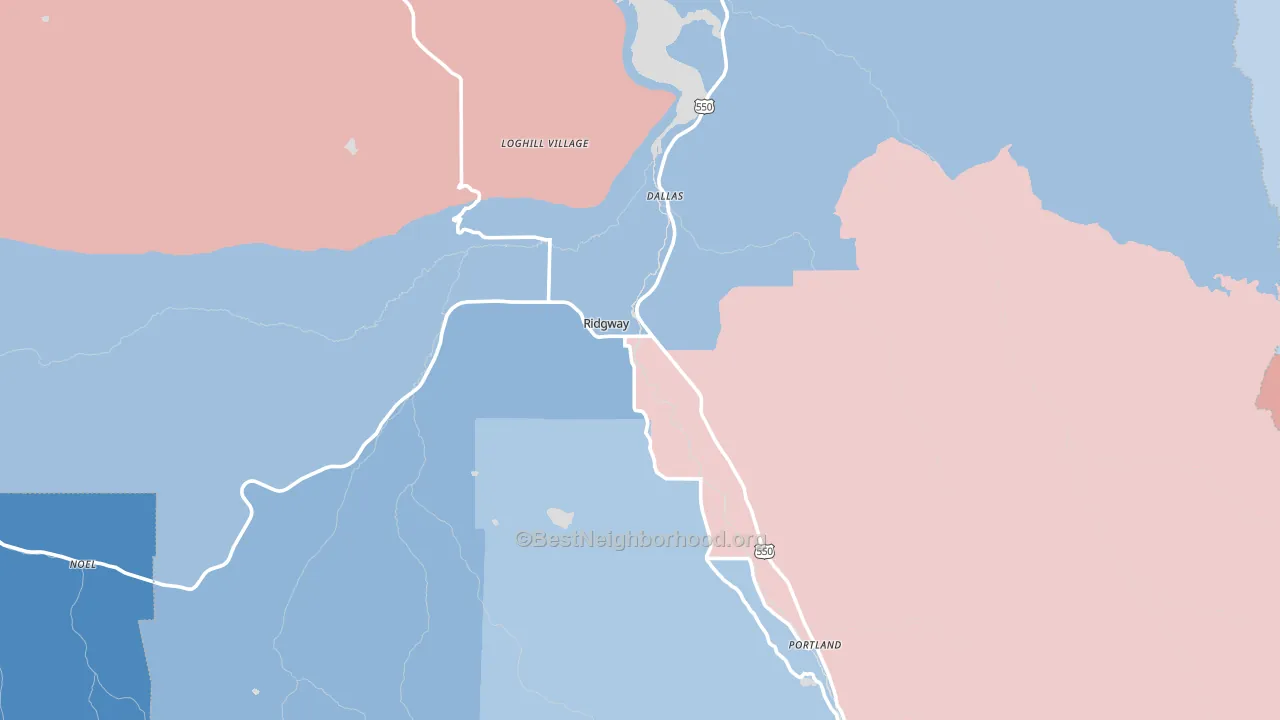
Ouray County leans slightly Democratic by roughly 12 points: about 56% of voters vote Democratic and 44% Republican.
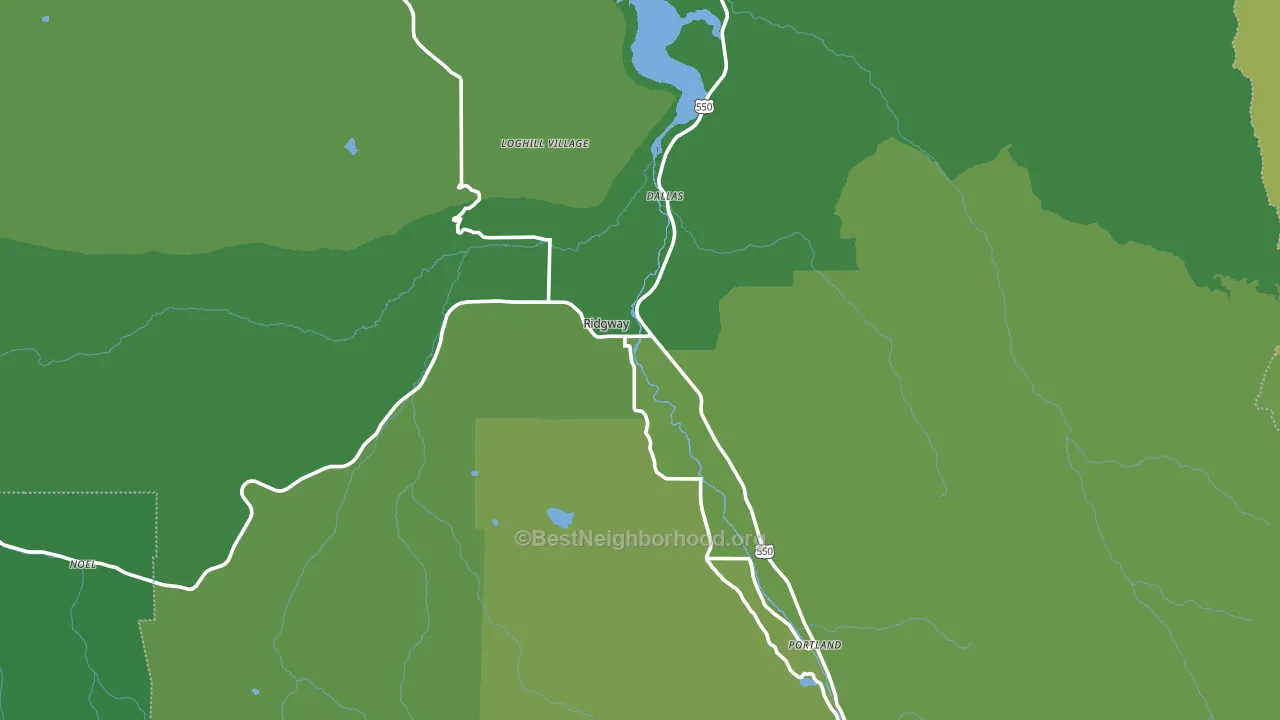
About 87% of adults in Ouray County typically vote, above the U.S. average of about 62%. Among adults in Ouray County, ~49% vote Democratic, ~38% Republican, and ~13% don't vote. The map below shows estimated turnout by block group.
How Ouray County compares
Among counties within 50 miles, Ouray County leans more Democratic than 3 of 5 neighbors.
Politically, Ouray County sits close to the rest of Colorado.
Politics vary noticeably by city within Ouray County. The east side runs the most Democratic (D+27) and the northwest side runs the most Republican (R+10), a spread of about 37 points.
Why Ouray County leans the way it does
This analysis examined 14,881 data points per county to find what predicts political lean and turnout. The items below are a few correlations that stood out for Ouray County, not a ranked or complete list of what matters most.
Areas with high college attainment vote Democratic. About 57% of adults in Ouray County hold a bachelor's degree, about 28 points above the U.S. average of 28%.
High-school completion, developed land, and voter turnout
Places that combine high-school-completion-heavy adults and a rural land-use pattern tend to turn out at a higher rate, as Ouray County, CO does.
Why turnout in Ouray County looks the way it does
Areas with strong routine healthcare access turn out at higher rates. Ouray County is in the top quarter nationally for routine-care measures such as insurance coverage, preventive screenings, and dental visits. The dental-visit rate here is about 72%, about 12 points above the U.S. average of 60%. Homeowners vote more often than renters, and about 83% of households in Ouray County own their home, above 92% of counties. High high-school completion lines up with higher turnout, and about 98% of adults in Ouray County have completed high school, in the top fraction of counties. Learn more about the findings and methodology on the political spectrum map.
Nearby Counties
- San Miguel County, CO D+35
- San Juan County, CO D+29
- Montrose County, CO R+30
- Hinsdale County, CO R+6
- Delta County, CO R+35
- Mineral County, CO R+5
- Gunnison County, CO D+31
- La Plata County, CO D+13
- Dolores County, CO R+45
- Montezuma County, CO R+24
Counties with Similar Populations
- Dillingham Census Area, AK D+19
- Craig County, VA R+64
- Jim Hogg County, TX R+2
- Rooks County, KS R+66
- Carlisle County, KY R+69
- Washington County, CO R+70
- Gallatin County, IL R+60
- Scott County, IL R+64
- Toole County, MT R+43
- Phillips County, KS R+68
Sources and methodology
Precinct-level voting records used to fit the model come from Colorado Secretary of State, Elections, distributed by the Voting and Election Science Team. Demographic inputs come from the U.S. Census Bureau (ACS 5-year estimates and the 2020 Decennial Census). Health and environmental inputs come from the CDC (PLACES and the Environmental Justice Index). Land cover comes from the USGS and EPA. Election-day and lead-up weather come from PRISM 4km daily grids and the NOAA Global Historical Climatology Network. Mail-voting and election-administration patterns come from the MIT Election Lab's Survey of the Performance of American Elections. Block-group crime detail comes from CrimeGrade. Internet data and modeling support provided by ISPreports.org.
Modeling and analysis by the BestNeighborhood data science team. Full methodology and findings: political spectrum map.
Methodology reviewed by the BestNeighborhood data team. Last updated May 2026.