Palo Pinto is a Republican stronghold. About 13% of voters here vote Democratic and 87% Republican.
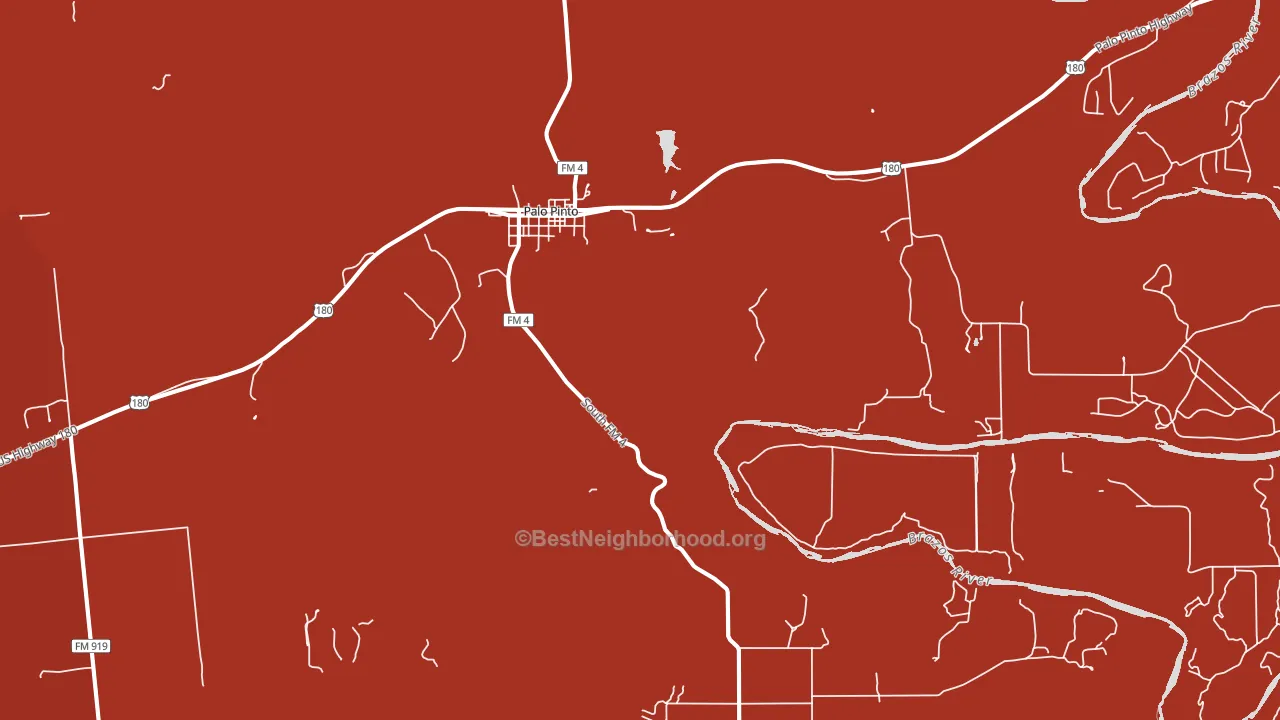
About 77% of adults in Palo Pinto typically vote, above the U.S. average of about 62%. Among adults in Palo Pinto, ~10% vote Democratic, ~67% Republican, and ~23% don't vote. The map below shows estimated turnout by block group.
How Palo Pinto compares
Among cities within 25 miles, Palo Pinto leans more Republican than 5 of 27 neighbors.
Palo Pinto runs about 60 points more Republican than Texas as a whole.
Why Palo Pinto leans the way it does
This analysis examined 14,881 data points per city to find what predicts political lean and turnout. The items below are a few correlations that stood out for Palo Pinto, not a ranked or complete list of what matters most.
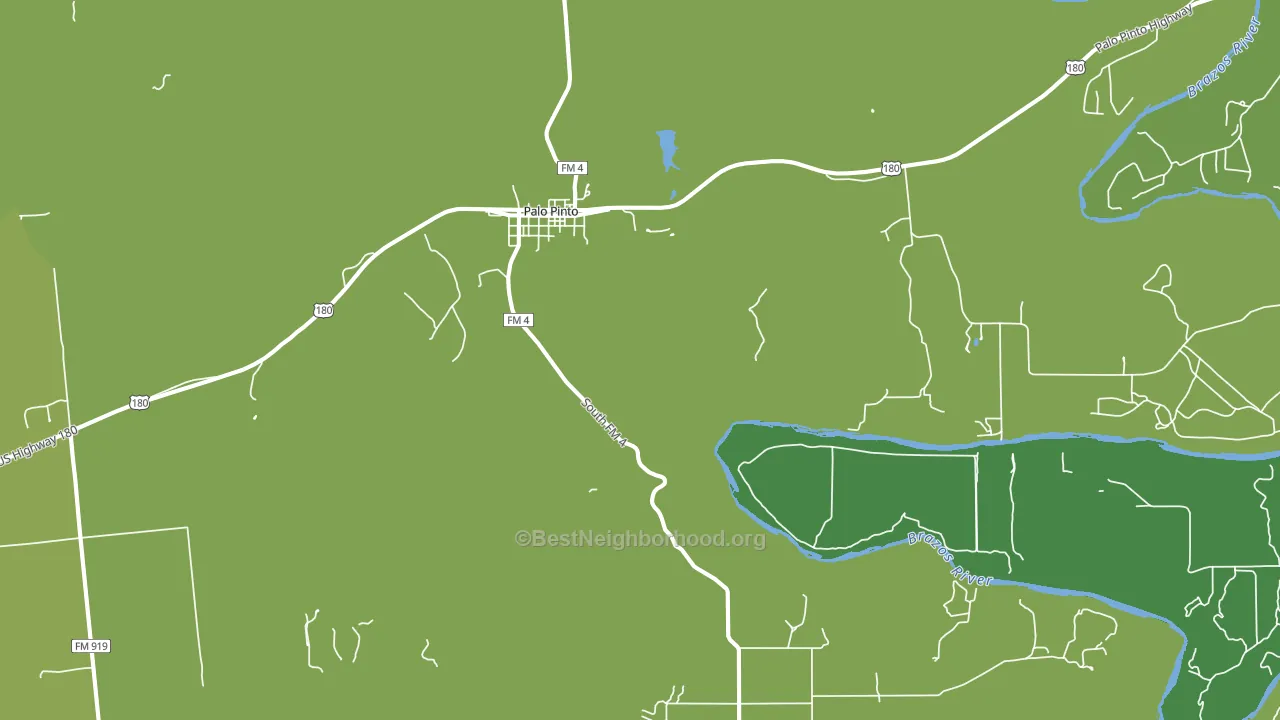
Rural areas vote Republican. About 4% of residents in Palo Pinto live in densely developed areas, about 31 points below the Texas average of 35%.
Population density, never-married share, and Republican lean
Places that combine low population density and a never-married-heavy adult population tend to lean Republican, as Palo Pinto, TX does.
Why turnout in Palo Pinto looks the way it does
Homeowners vote more often than renters. About 98% of households in Palo Pinto own their home, about 24 points above the Texas average of 75%. Learn more about the findings and methodology on the political spectrum map.
Nearby Cities
- Lone Camp, TX R+75
- Santo, TX R+75
- Metcalf Gap, TX R+73
- Mineral Wells, TX R+55
- Gordon, TX R+75
- Graford, TX R+79
- Sturdivant, TX R+76
- Salesville, TX R+78
- New Salem, TX R+75
- Strawn, TX R+71
Cities with Similar Populations
- Volente, TX R+16
- Stella Niagara, NY R+15
- Mayhill, NM R+44
- Earley, NC D+12
- Emden, IL R+57
- Spring Run, PA R+74
- North Pembroke, NH Even
- Bryantsville, IN R+61
- Plymouth, NY R+48
- Lane, KS R+57
Sources and methodology
Precinct-level voting records used to fit the model come from Texas Secretary of State, Elections Division, distributed by the Voting and Election Science Team. Demographic inputs come from the U.S. Census Bureau (ACS 5-year estimates and the 2020 Decennial Census). Health and environmental inputs come from the CDC (PLACES and the Environmental Justice Index). Land cover comes from the USGS and EPA. Election-day and lead-up weather come from PRISM 4km daily grids and the NOAA Global Historical Climatology Network. Mail-voting and election-administration patterns come from the MIT Election Lab's Survey of the Performance of American Elections. Block-group crime detail comes from CrimeGrade. Internet data and modeling support provided by ISPreports.org.
Modeling and analysis by the BestNeighborhood data science team. Full methodology and findings: political spectrum map.
Methodology reviewed by the BestNeighborhood data team. Last updated May 2026.