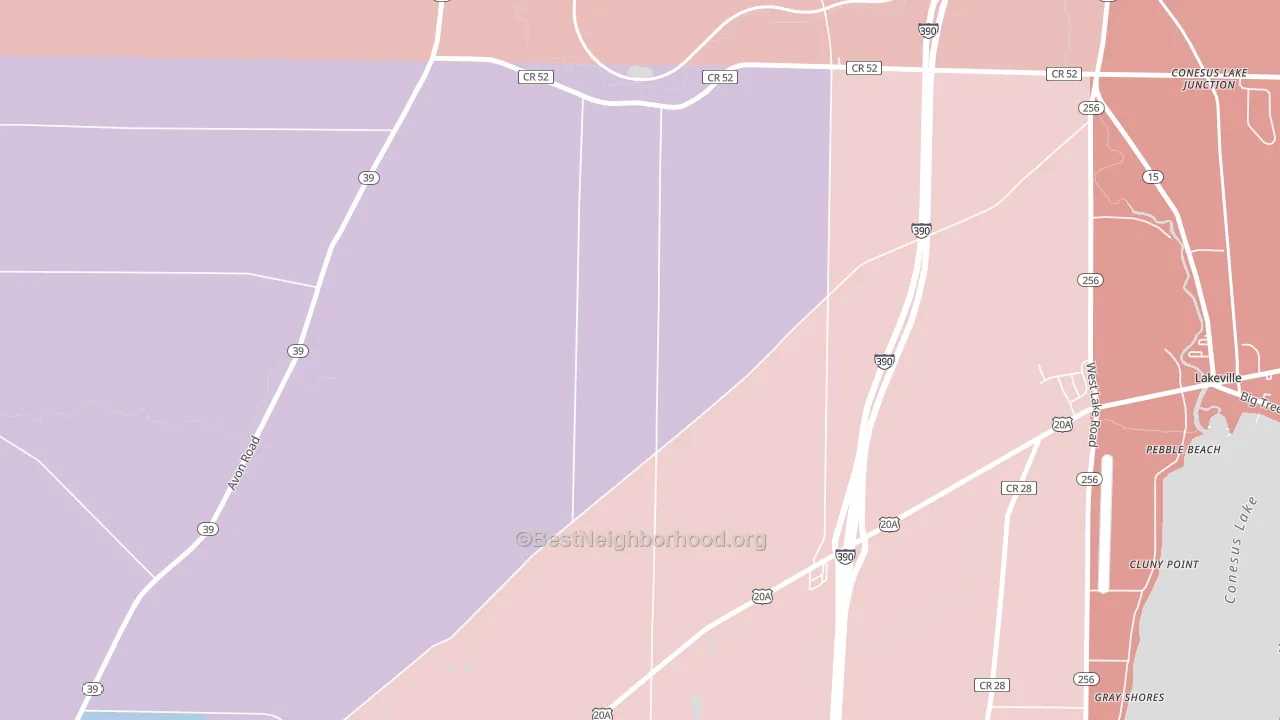
Pebble Beach leans slightly Republican by roughly 14 points: about 43% of voters vote Democratic and 57% Republican.
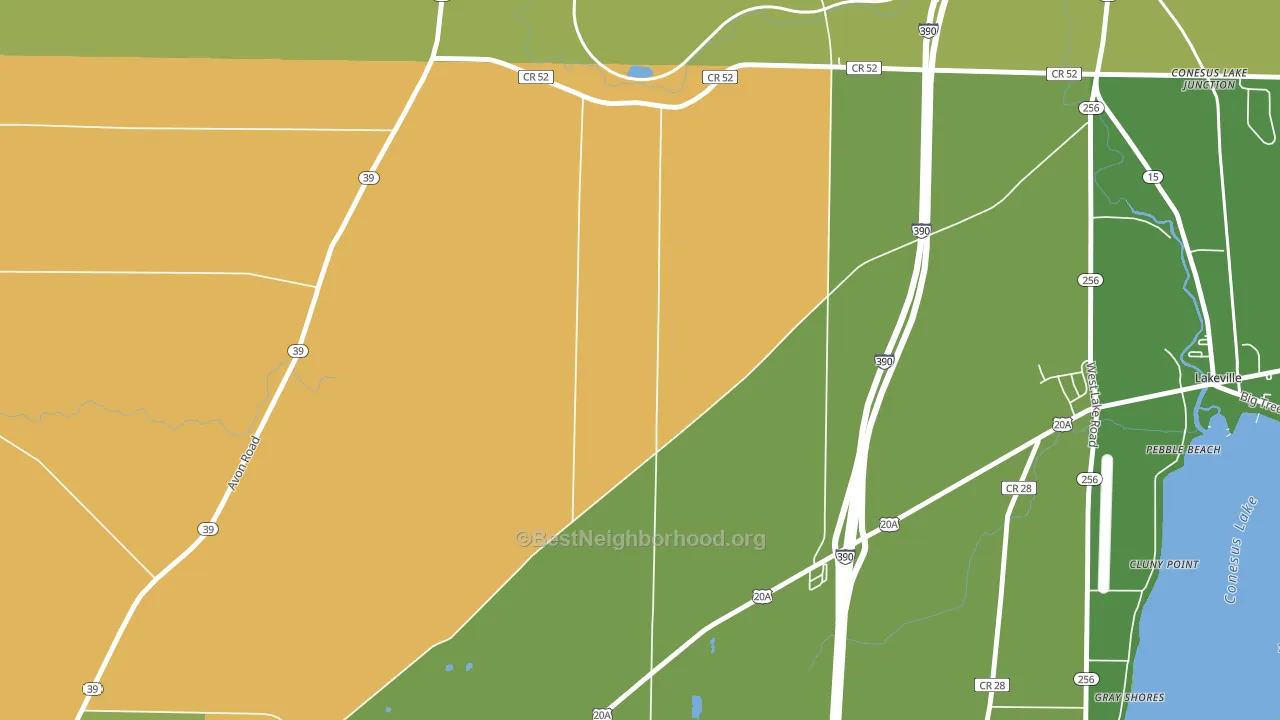
About 43% of adults in Pebble Beach typically vote, below the U.S. average of about 62%. Among adults in Pebble Beach, ~18% vote Democratic, ~25% Republican, and ~57% don't vote. The map below shows estimated turnout by block group.
How Pebble Beach compares
Among cities within 25 miles, Pebble Beach leans more Republican than 35 of 118 neighbors.
Pebble Beach runs about 26 points more Republican than New York as a whole. New York leans Democratic overall, while Pebble Beach is one of the few Republican-leaning pockets.
Why Pebble Beach leans the way it does
This analysis examined 14,881 data points per city to find what predicts political lean and turnout. The items below are a few correlations that stood out for Pebble Beach, not a ranked or complete list of what matters most.
Car-dependent areas vote Republican. About 87% of residents in Pebble Beach drive to work alone, about 14 points above the U.S. average of 74%. Pebble Beach runs against the grain of New York, a Republican-leaning pocket in a Democratic-leaning state.
Never-married share and voter turnout
Places with a never-married-heavy adult population tend to turn out at a lower rate; Pebble Beach, NY sits in the top tenth nationally on this measure.
Why turnout in Pebble Beach looks the way it does
Renters vote less often than owners. About 72% of households in Pebble Beach rent, about 47 points above the U.S. average of 25%. Learn more about the findings and methodology on the political spectrum map.
Nearby Cities
- Lakeville, NY R+19
- Geneseo, NY D+15
- South Lima, NY R+17
- Avon, NY R+10
- Livonia, NY R+22
- East Avon, NY R+14
- Retsof, NY R+32
- Fowlerville, NY R+31
- Piffard, NY R+33
Cities with Similar Populations
- Howells Crossroads, AL R+53
- Porto Rico, WV R+72
- Portland Mills, IN R+60
- Vale, TN R+71
- Kadesh, LA R+63
- Hazen, PA R+69
- Laurin, MT R+51
- Colfax, PA R+69
- Hampden, AL D+41
- Sarton, WV R+56
Sources and methodology
Precinct-level voting records used to fit the model come from New York State Board of Elections, distributed by the Voting and Election Science Team. Demographic inputs come from the U.S. Census Bureau (ACS 5-year estimates and the 2020 Decennial Census). Health and environmental inputs come from the CDC (PLACES and the Environmental Justice Index). Land cover comes from the USGS and EPA. Election-day and lead-up weather come from PRISM 4km daily grids and the NOAA Global Historical Climatology Network. Mail-voting and election-administration patterns come from the MIT Election Lab's Survey of the Performance of American Elections. Block-group crime detail comes from CrimeGrade. Internet data and modeling support provided by ISPreports.org.
Modeling and analysis by the BestNeighborhood data science team. Full methodology and findings: political spectrum map.
Methodology reviewed by the BestNeighborhood data team. Last updated May 2026.