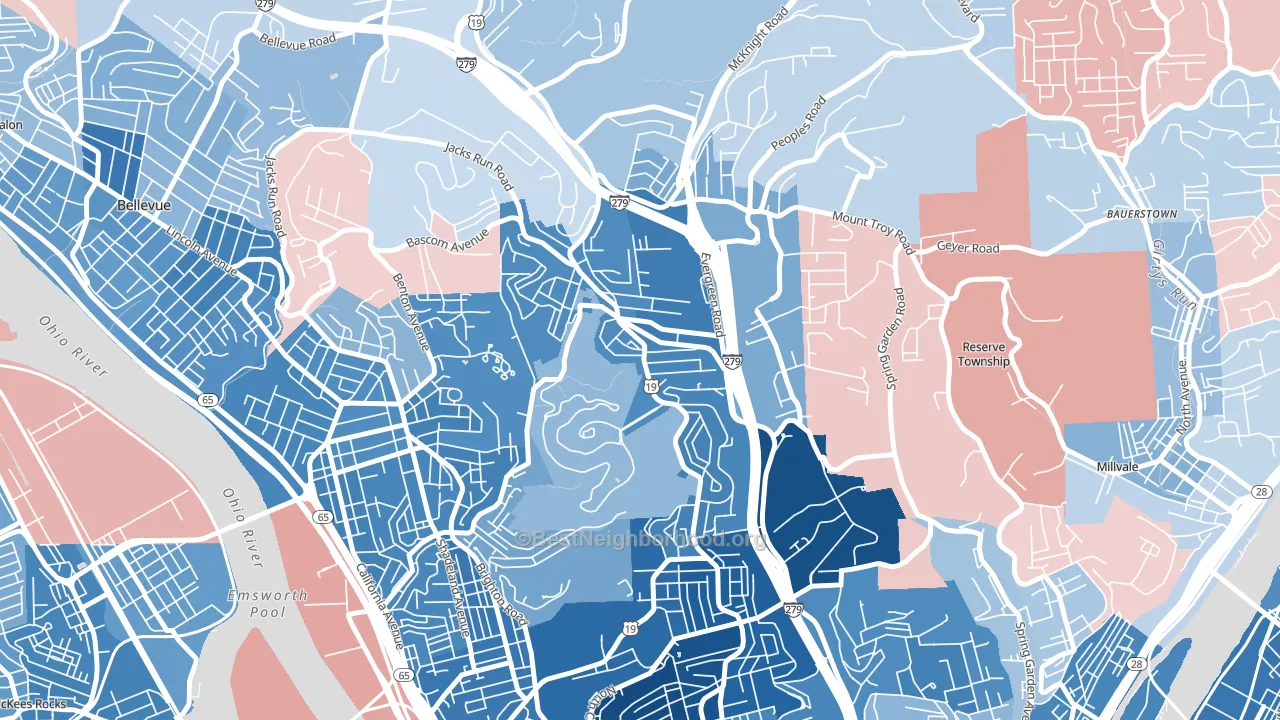
Perry North leans heavily Democratic by roughly 46 points: about 73% of voters vote Democratic and 27% Republican.
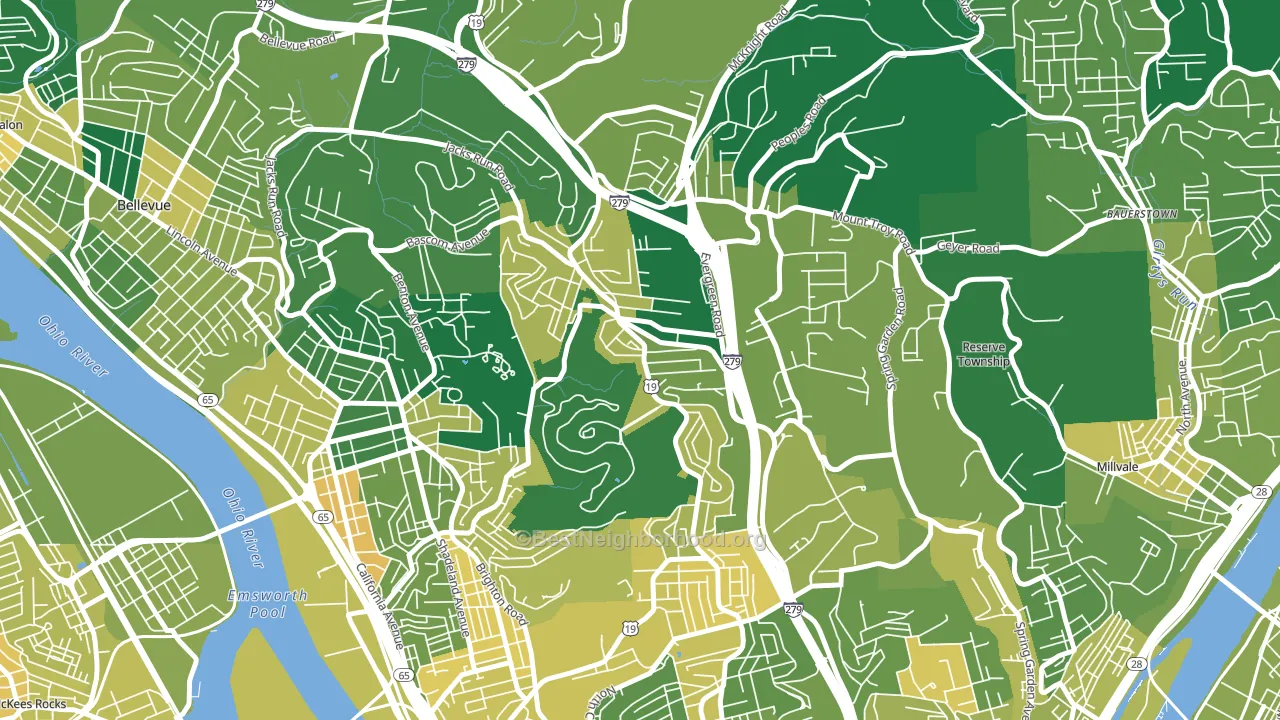
About 73% of adults in Perry North typically vote, above the U.S. average of about 62%. Among adults in Perry North, ~53% vote Democratic, ~20% Republican, and ~27% don't vote. The map below shows estimated turnout by block group.
How Perry North compares
Among neighborhoods within 5 miles, Perry North leans more Democratic than 4 of 19 neighbors.
Perry North runs about 48 points more Democratic than Pennsylvania as a whole. Pennsylvania is roughly evenly split, and Perry North sits clearly on the Democratic side.
Politics vary noticeably by block within Perry North. The southeast side is the most Democratic-leaning (D+52) and the southwest side is the least Democratic-leaning (D+36), a spread of about 17 points.
Why Perry North leans the way it does
This analysis examined 14,881 data points per neighborhood to find what predicts political lean and turnout. The items below are a few correlations that stood out for Perry North, not a ranked or complete list of what matters most.
Perry North votes against the grain of Pennsylvania. Pennsylvania is roughly evenly split, while Perry North runs about 48 points more Democratic.
Population density and Democratic lean
Places with high population density tend to lean Democratic; Perry North, Pittsburgh, PA sits above the national average on this measure.
Why turnout in Perry North looks the way it does
High high-school completion lines up with higher turnout, and about 98% of adults in Perry North have completed high school, above 81% of neighborhoods. Learn more about the findings and methodology on the political spectrum map.
Nearby Neighborhoods
- Brighton Heights, Pittsburgh, PA D+43
- Perry South, Pittsburgh, PA D+77
- Marshall-Shadeland, Pittsburgh, PA D+56
- Central Northside, Pittsburgh, PA D+74
- Sheraden, Pittsburgh, PA D+49
- Central Lawrenceville, Pittsburgh, PA D+58
- Central Business District, Pittsburgh, PA D+55
- Crafton Heights, Pittsburgh, PA D+32
- Bluff, Pittsburgh, PA D+48
- Bloomfield, Pittsburgh, PA D+64
Neighborhoods with Similar Populations
- North Leg, Augusta, GA D+50
- West End, Concord, NH D+48
- Riverview-Santa Ana, Santa Ana, CA D+28
- Lancaster Historic District, Lancaster, OH R+15
- Seven Eagles, Charlotte, NC D+14
- Spring Isle, Alafaya, FL D+11
- Bowie, Lubbock, TX R+18
- Douglas Acres, Des Moines, IA D+4
- Deer Park, Louisville, KY D+61
- University Park-Jacksonville, Jacksonville, FL D+26
Sources and methodology
Precinct-level voting records used to fit the model come from Pennsylvania Department of State, Bureau of Elections, distributed by the Voting and Election Science Team. Demographic inputs come from the U.S. Census Bureau (ACS 5-year estimates and the 2020 Decennial Census). Health and environmental inputs come from the CDC (PLACES and the Environmental Justice Index). Land cover comes from the USGS and EPA. Election-day and lead-up weather come from PRISM 4km daily grids and the NOAA Global Historical Climatology Network. Mail-voting and election-administration patterns come from the MIT Election Lab's Survey of the Performance of American Elections. Block-group crime detail comes from CrimeGrade. Internet data and modeling support provided by ISPreports.org.
Modeling and analysis by the BestNeighborhood data science team. Full methodology and findings: political spectrum map.
Methodology reviewed by the BestNeighborhood data team. Last updated May 2026.