Phelps leans heavily Democratic by roughly 32 points: about 66% of voters vote Democratic and 34% Republican.
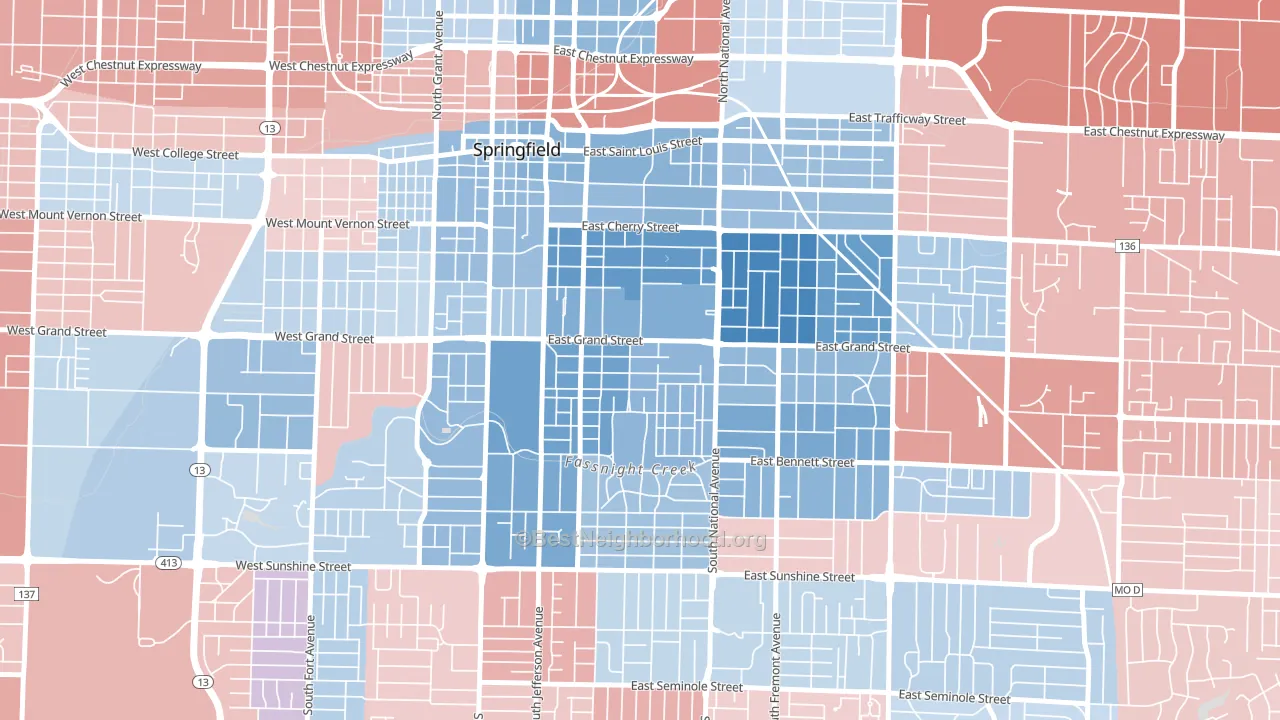
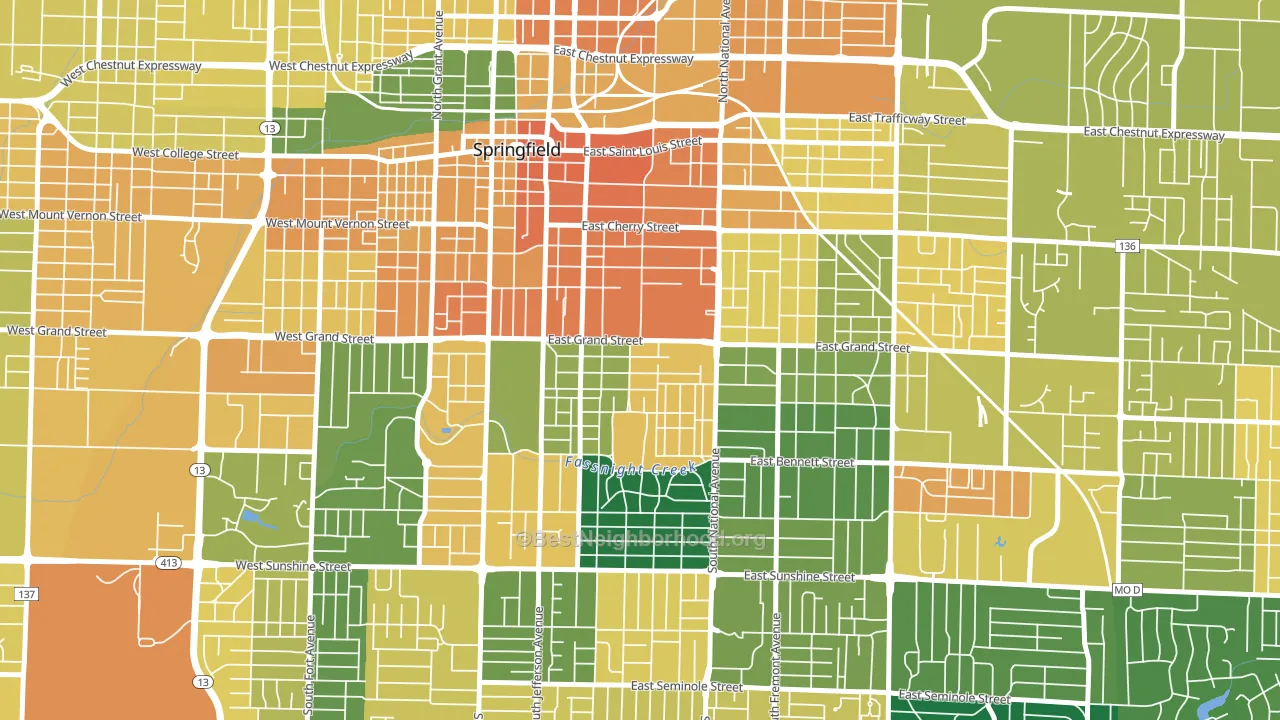
About 48% of adults in Phelps typically vote, below the U.S. average of about 62%. Among adults in Phelps, ~32% vote Democratic, ~16% Republican, and ~52% don't vote. The map below shows estimated turnout by block group.
How Phelps compares
Among neighborhoods within 5 miles, Phelps leans more Democratic than 21 of 22 neighbors.
Phelps runs about 50 points more Democratic than Missouri as a whole. Missouri leans Republican overall, while Phelps is one of the few Democratic-leaning pockets.
Why Phelps leans the way it does
This analysis examined 14,881 data points per neighborhood to find what predicts political lean and turnout. The items below are a few correlations that stood out for Phelps, not a ranked or complete list of what matters most.
Phelps votes against the grain of Missouri. Missouri leans Republican overall, while Phelps runs about 50 points more Democratic. A high never-married share predicts Democratic voting, and about 65% of adults in Phelps have never been married, above 96% of neighborhoods.
Preventive-care access and voter turnout
Places with limited routine preventive-care access tend to turn out at a lower rate; Phelps, Springfield, MO sits below the national average on this measure. Dental visits do not drive turnout; the rate reflects income, insurance, and healthcare access, which line up with who votes.
Why turnout in Phelps looks the way it does
Renters vote less often than owners. About 68% of households in Phelps rent, about 43 points above the U.S. average of 25%. Low high-school completion lines up with lower turnout, and about 98% of adults in Phelps have completed high school, above 81% of neighborhoods. Learn more about the findings and methodology on the political spectrum map.
Nearby Neighborhoods
- Rountree, Springfield, MO D+41
- Downtown Springfield, Springfield, MO D+19
- West Central, Springfield, MO D+10
- Seminole Holland, Springfield, MO R+4
- Fassnight, Springfield, MO D+7
- Midtown Springfield, Springfield, MO D+17
- Meador Park, Springfield, MO R+5
- Bingham, Springfield, MO R+3
- Weller, Springfield, MO D+8
- Grant Beach, Springfield, MO Even
Neighborhoods with Similar Populations
- Mott Section, Garden City, NY D+4
- Thurston, Ann Arbor, MI D+66
- Sherwood Forest, Jacksonville, FL D+78
- Epes, Newport News, VA D+61
- Brookhaven, Norman, OK Even
- Freestate-North Highlands, Shreveport, LA D+46
- Fort Howard, Green Bay, WI D+12
- Canton, Salisbury, MD D+45
- 40th and A, Lincoln, NE D+28
- Ralston Valley, Arvada, CO D+6
Sources and methodology
Precinct-level voting records used to fit the model come from Missouri Secretary of State, Elections, distributed by the Voting and Election Science Team. Demographic inputs come from the U.S. Census Bureau (ACS 5-year estimates and the 2020 Decennial Census). Health and environmental inputs come from the CDC (PLACES and the Environmental Justice Index). Land cover comes from the USGS and EPA. Election-day and lead-up weather come from PRISM 4km daily grids and the NOAA Global Historical Climatology Network. Mail-voting and election-administration patterns come from the MIT Election Lab's Survey of the Performance of American Elections. Block-group crime detail comes from CrimeGrade. Internet data and modeling support provided by ISPreports.org.
Modeling and analysis by the BestNeighborhood data science team. Full methodology and findings: political spectrum map.
Methodology reviewed by the BestNeighborhood data team. Last updated May 2026.