Pine County leans heavily Republican by roughly 38 points: about 31% of voters vote Democratic and 69% Republican.
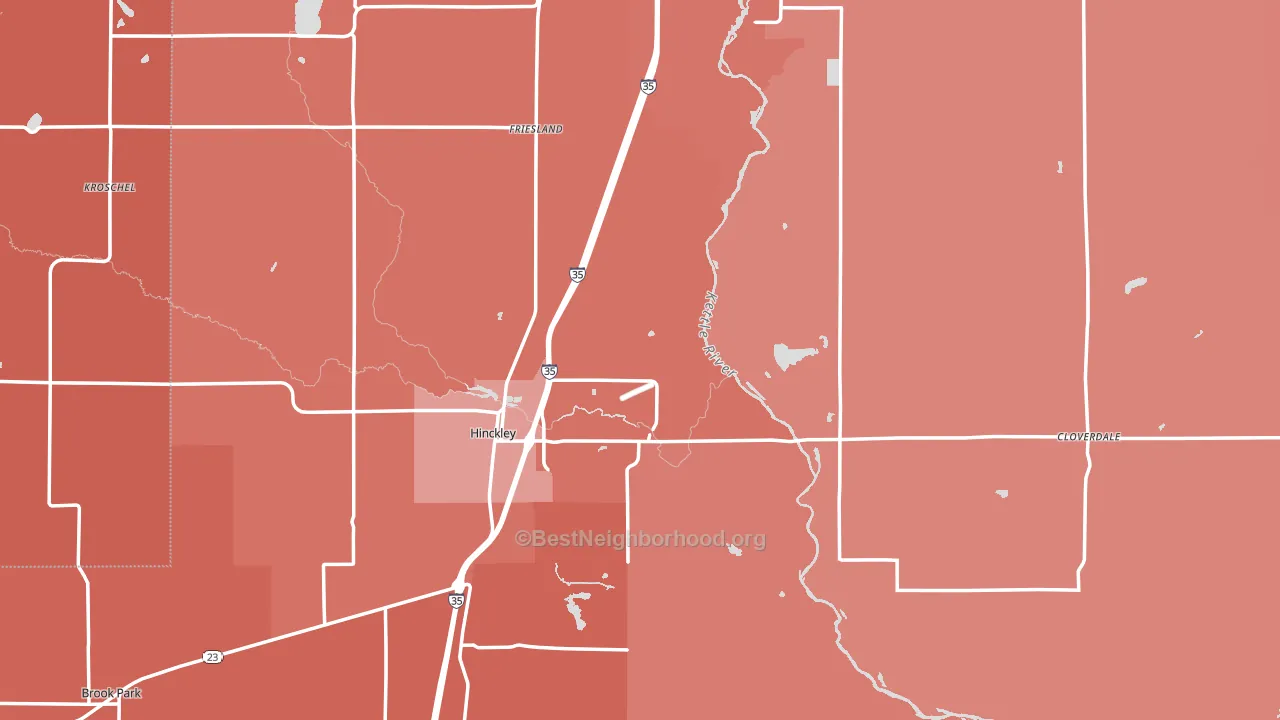
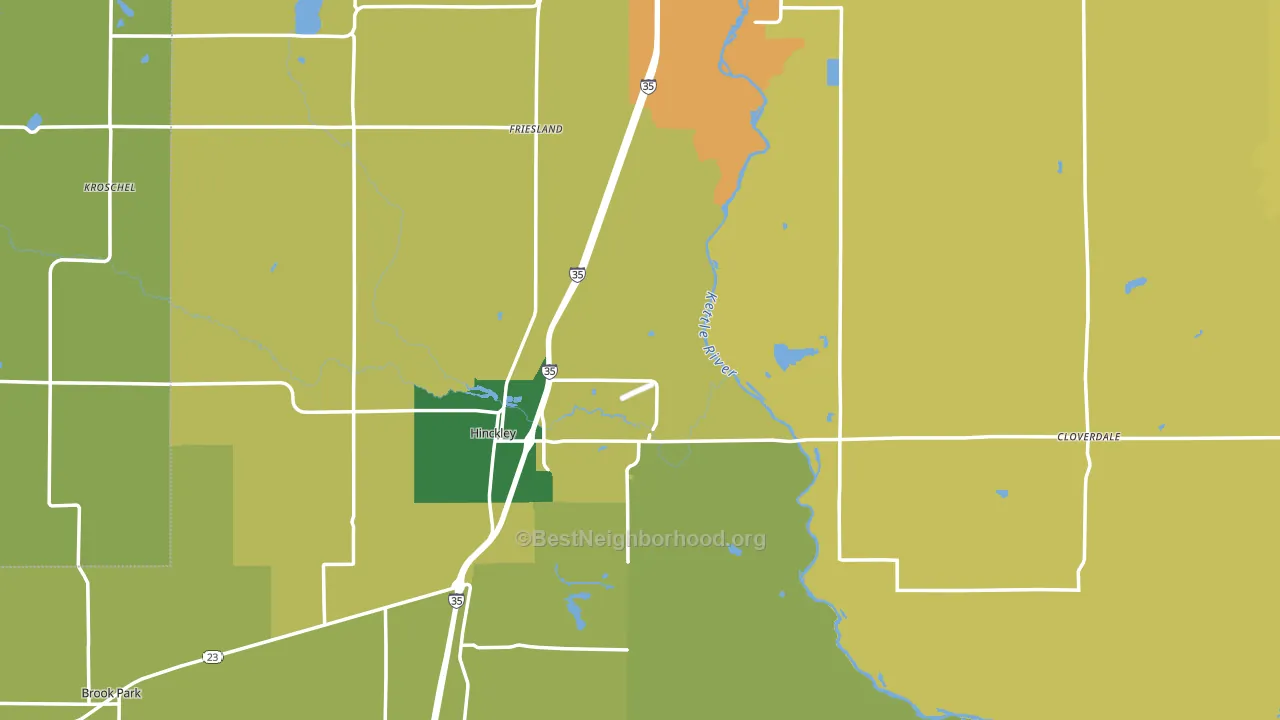
About 69% of adults in Pine County typically vote, above the U.S. average of about 62%. Among adults in Pine County, ~21% vote Democratic, ~48% Republican, and ~31% don't vote. The map below shows estimated turnout by block group.
How Pine County compares
Among counties within 50 miles, Pine County leans more Republican than 6 of 8 neighbors.
Pine County runs about 41 points more Republican than Minnesota as a whole. Minnesota leans Democratic overall, while Pine County is one of the few Republican-leaning pockets.
Politics vary noticeably by city within Pine County. The northwest side is the most Republican-leaning (R+46) and the northeast side is the least Republican-leaning (R+32), a spread of about 14 points.
Why Pine County leans the way it does
This analysis examined 14,881 data points per county to find what predicts political lean and turnout. The items below are a few correlations that stood out for Pine County, not a ranked or complete list of what matters most.
Pine County votes against the grain of Minnesota. Minnesota leans Democratic overall, while Pine County runs about 41 points more Republican.
Homeownership and voter turnout
Places with homeowner-heavy households tend to turn out at a higher rate; Pine County, MN sits in the top quarter nationally on this measure.
Why turnout in Pine County looks the way it does
Homeowners vote more often than renters. About 82% of households in Pine County own their home, about 7 points above the U.S. average of 75%. Learn more about the findings and methodology on the political spectrum map.
Nearby Counties
- Kanabec County, MN R+44
- Burnett County, WI R+32
- Isanti County, MN R+34
- Mille Lacs County, MN R+42
- Chisago County, MN R+29
- Carlton County, MN R+12
- Polk County, WI R+33
- Aitkin County, MN R+33
- Washburn County, WI R+31
- Douglas County, WI Even
Counties with Similar Populations
- Alpena County, MI R+25
- Marion County, TN R+62
- Glenn County, CA R+32
- Van Wert County, OH R+56
- Ellis County, KS R+38
- Garrett County, MD R+50
- Fayette County, OH R+55
- Jasper County, SC Even
- Cherokee County, NC R+51
- Ripley County, IN R+59
Sources and methodology
Precinct-level voting records used to fit the model come from Minnesota Secretary of State, Elections, distributed by the Voting and Election Science Team. Demographic inputs come from the U.S. Census Bureau (ACS 5-year estimates and the 2020 Decennial Census). Health and environmental inputs come from the CDC (PLACES and the Environmental Justice Index). Land cover comes from the USGS and EPA. Election-day and lead-up weather come from PRISM 4km daily grids and the NOAA Global Historical Climatology Network. Mail-voting and election-administration patterns come from the MIT Election Lab's Survey of the Performance of American Elections. Block-group crime detail comes from CrimeGrade. Internet data and modeling support provided by ISPreports.org.
Modeling and analysis by the BestNeighborhood data science team. Full methodology and findings: political spectrum map.
Methodology reviewed by the BestNeighborhood data team. Last updated May 2026.