Richland County is a Republican stronghold. About 19% of voters here vote Democratic and 81% Republican.
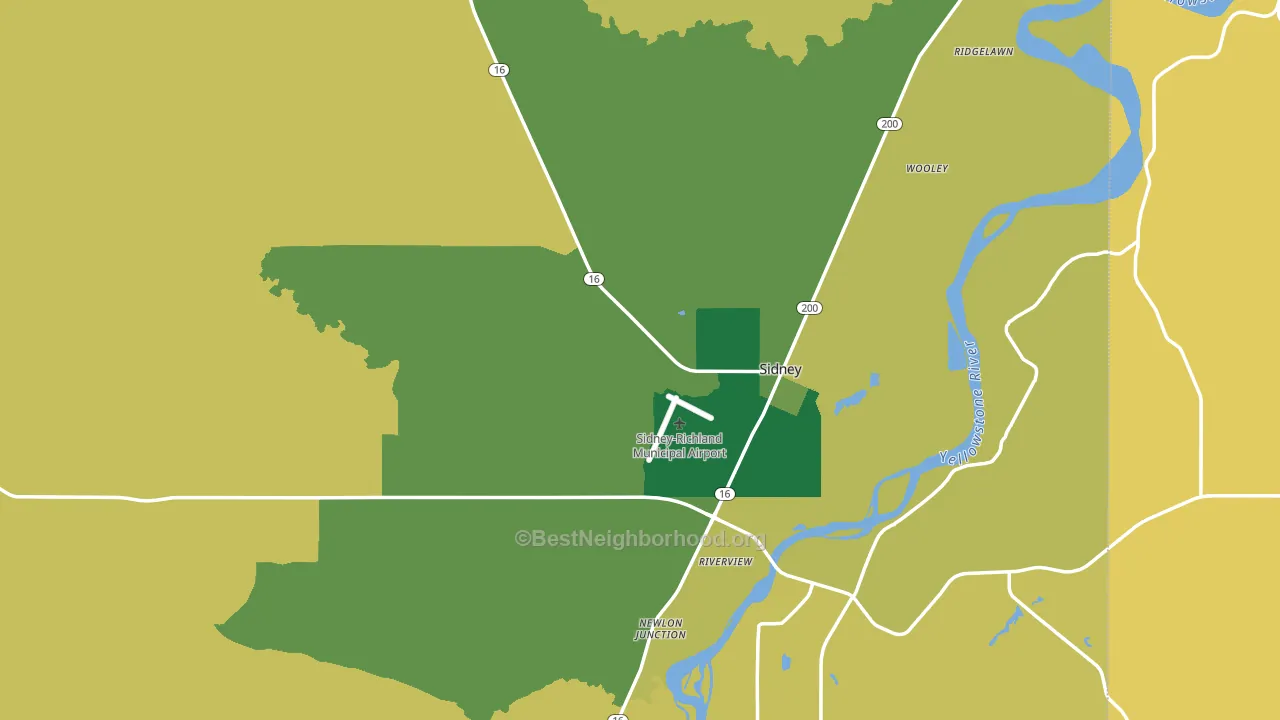
About 78% of adults in Richland County typically vote, above the U.S. average of about 62%. Among adults in Richland County, ~15% vote Democratic, ~63% Republican, and ~22% don't vote. The map below shows estimated turnout by block group.
How Richland County compares
Among counties within 50 miles, Richland County is the most Republican-leaning.
Richland County runs about 42 points more Republican than Montana as a whole.
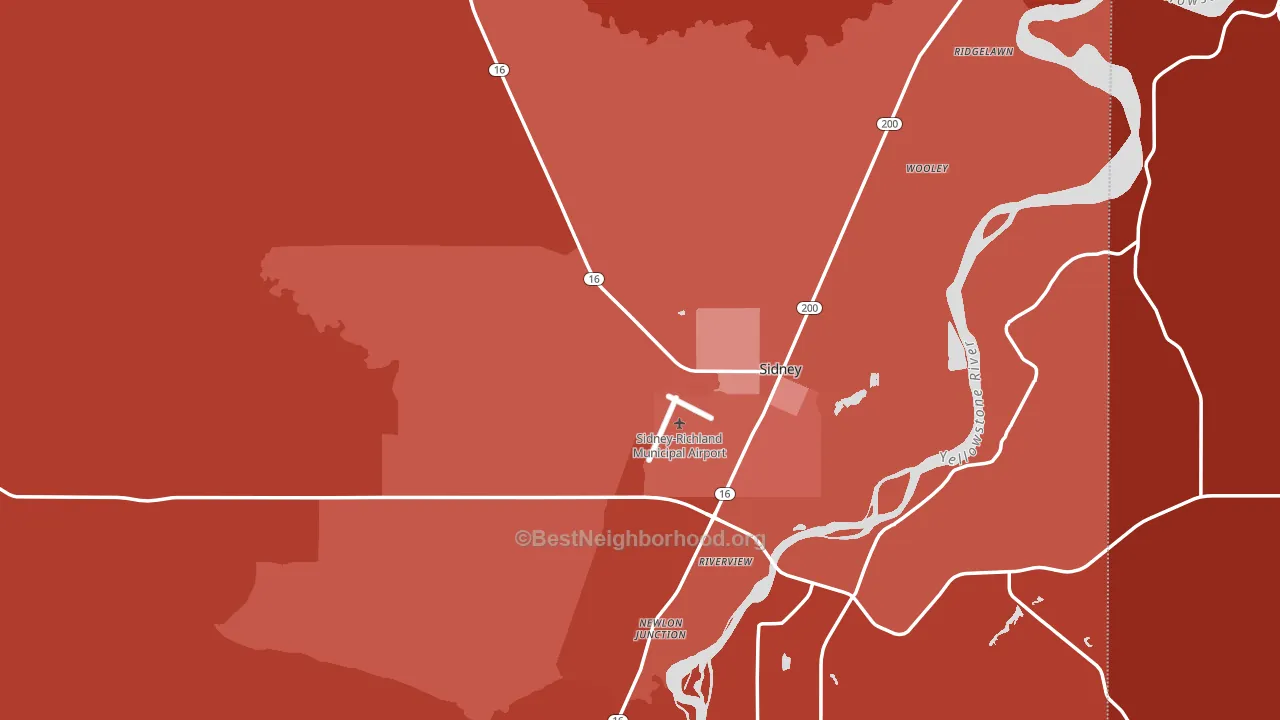
Politics vary noticeably by city within Richland County. The northeast side is the most Republican-leaning (R+72) and the east side is the least Republican-leaning (R+58), a spread of about 15 points.
Why Richland County leans the way it does
Density, race composition, education, and family structure all sit close to their national averages in Richland County. The lean here lands roughly where demographic data alone would predict.
Food insecurity and voter turnout
Places with low food insecurity tend to turn out at a higher rate; Richland County, MT sits in the bottom tenth nationally on this measure. Food insecurity does not directly drive turnout; it reflects economic hardship, which lines up with lower voting.
Why turnout in Richland County looks the way it does
Areas with high high-school completion turn out at higher rates. About 95% of adults in Richland County have completed high school, about 5 points above the U.S. average of 90%. Learn more about the findings and methodology on the political spectrum map.
Nearby Counties
- Williams County, ND R+61
- McKenzie County, ND R+56
- Dawson County, MT R+55
- Wibaux County, MT R+75
- Roosevelt County, MT Even
- Golden Valley County, ND R+69
- Billings County, ND R+67
- McCone County, MT R+72
- Sheridan County, MT R+58
- Dunn County, ND R+53
Counties with Similar Populations
- Perry County, MS R+58
- Cottonwood County, MN R+46
- Big Horn County, WY R+73
- Charlotte County, VA R+31
- Fergus County, MT R+50
- Rio Grande County, CO R+22
- Decatur County, TN R+69
- Haskell County, OK R+69
- Heard County, GA R+71
- Sierra County, NM R+17
Sources and methodology
Precinct-level voting records used to fit the model come from Montana Secretary of State, Elections, distributed by the Voting and Election Science Team. Demographic inputs come from the U.S. Census Bureau (ACS 5-year estimates and the 2020 Decennial Census). Health and environmental inputs come from the CDC (PLACES and the Environmental Justice Index). Land cover comes from the USGS and EPA. Election-day and lead-up weather come from PRISM 4km daily grids and the NOAA Global Historical Climatology Network. Mail-voting and election-administration patterns come from the MIT Election Lab's Survey of the Performance of American Elections. Block-group crime detail comes from CrimeGrade. Internet data and modeling support provided by ISPreports.org.
Modeling and analysis by the BestNeighborhood data science team. Full methodology and findings: political spectrum map.
Methodology reviewed by the BestNeighborhood data team. Last updated May 2026.