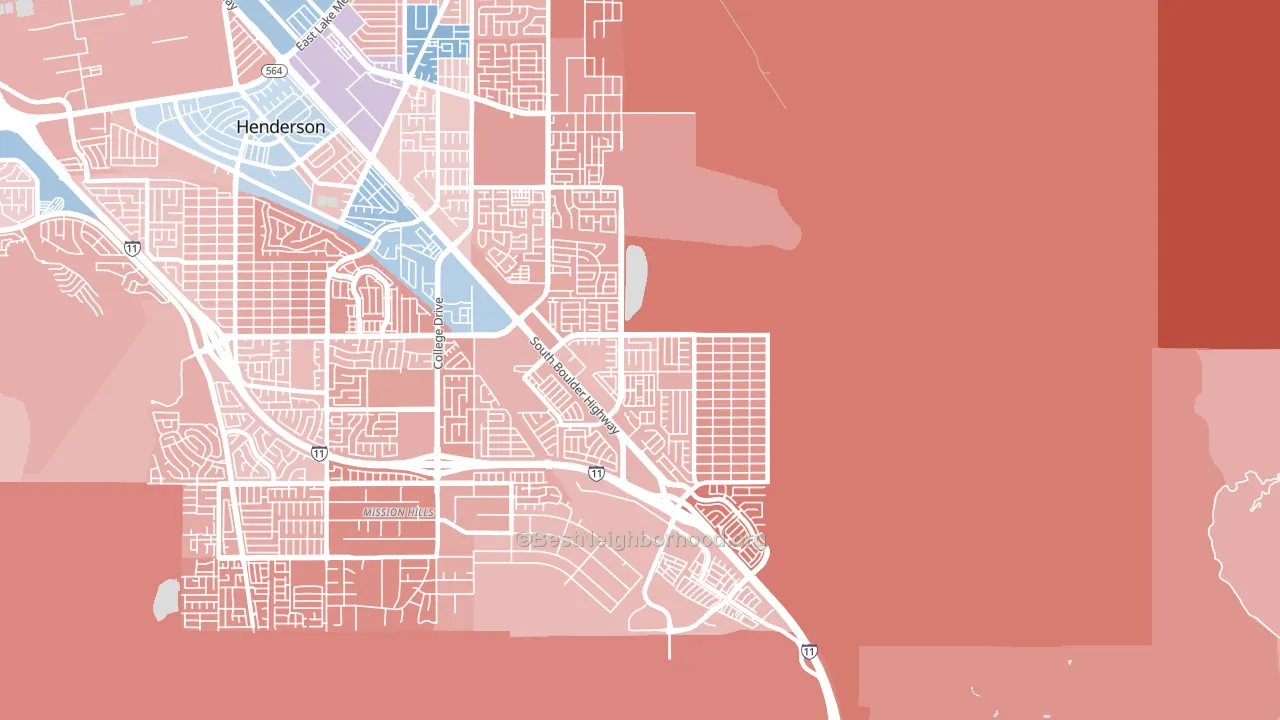
River Mountain leans slightly Republican by roughly 12 points: about 44% of voters vote Democratic and 56% Republican.
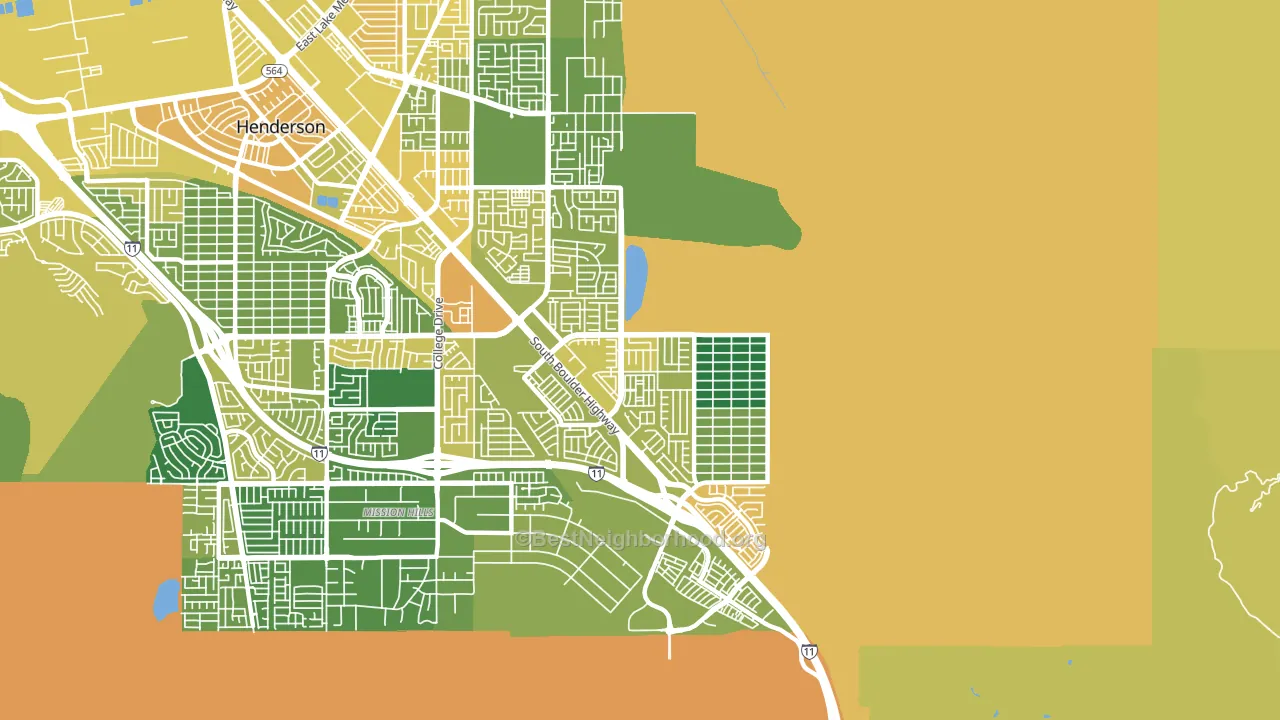
About 66% of adults in River Mountain typically vote, near the U.S. average of about 62%. Among adults in River Mountain, ~29% vote Democratic, ~37% Republican, and ~34% don't vote. The map below shows estimated turnout by block group.
How River Mountain compares
Among neighborhoods within 5 miles, River Mountain leans more Republican than 7 of 9 neighbors.
River Mountain runs about 10 points more Republican than Nevada as a whole.
Politics vary noticeably by block within River Mountain. The southeast side is the most Republican-leaning (R+29) and the west side is the least Republican-leaning (R+5), a spread of about 24 points.
Why River Mountain leans the way it does
Density, race composition, education, and family structure all sit close to their national averages in River Mountain. The lean here lands roughly where demographic data alone would predict.
Homeownership and voter turnout
Places with homeowner-heavy households tend to turn out at a higher rate; River Mountain, Henderson, NV sits in the top quarter nationally on this measure.
Why turnout in River Mountain looks the way it does
Homeowners vote more often than renters. About 87% of households in River Mountain own their home, about 16 points above the Nevada average of 71%. Learn more about the findings and methodology on the political spectrum map.
Nearby Neighborhoods
- Mission Hills, Henderson, NV R+11
- Highland Hills, Henderson, NV R+9
- Black Mountain, Henderson, NV R+4
- Foothills, Henderson, NV R+17
- Paradise Hills, Henderson, NV R+17
- Valley View, Henderson, NV D+3
- Townsite, Henderson, NV Even
- Calico Ridge, Henderson, NV R+4
- McCullough Hills, Henderson, NV D+4
- Pittman, Henderson, NV D+5
Neighborhoods with Similar Populations
- Greater Wythe, Hampton, VA D+59
- Glover Park, Washington, DC D+76
- Fern Creek, Louisville, KY Even
- South Arroyo, Pasadena, CA D+55
- East Village, San Diego, CA D+44
- Elmhurst, Providence, RI D+31
- East Little York-Homestead, Houston, TX D+65
- Douglas, Chicago, IL D+79
- Naglee Park, San Jose, CA D+53
- Hybla Valley, Alexandria, VA D+43
Sources and methodology
Precinct-level voting records used to fit the model come from Nevada Secretary of State, Elections, distributed by the Voting and Election Science Team. Demographic inputs come from the U.S. Census Bureau (ACS 5-year estimates and the 2020 Decennial Census). Health and environmental inputs come from the CDC (PLACES and the Environmental Justice Index). Land cover comes from the USGS and EPA. Election-day and lead-up weather come from PRISM 4km daily grids and the NOAA Global Historical Climatology Network. Mail-voting and election-administration patterns come from the MIT Election Lab's Survey of the Performance of American Elections. Block-group crime detail comes from CrimeGrade. Internet data and modeling support provided by ISPreports.org.
Modeling and analysis by the BestNeighborhood data science team. Full methodology and findings: political spectrum map.
Methodology reviewed by the BestNeighborhood data team. Last updated May 2026.