Riverdale is a Democratic stronghold. About 92% of voters here vote Democratic and 8% Republican.
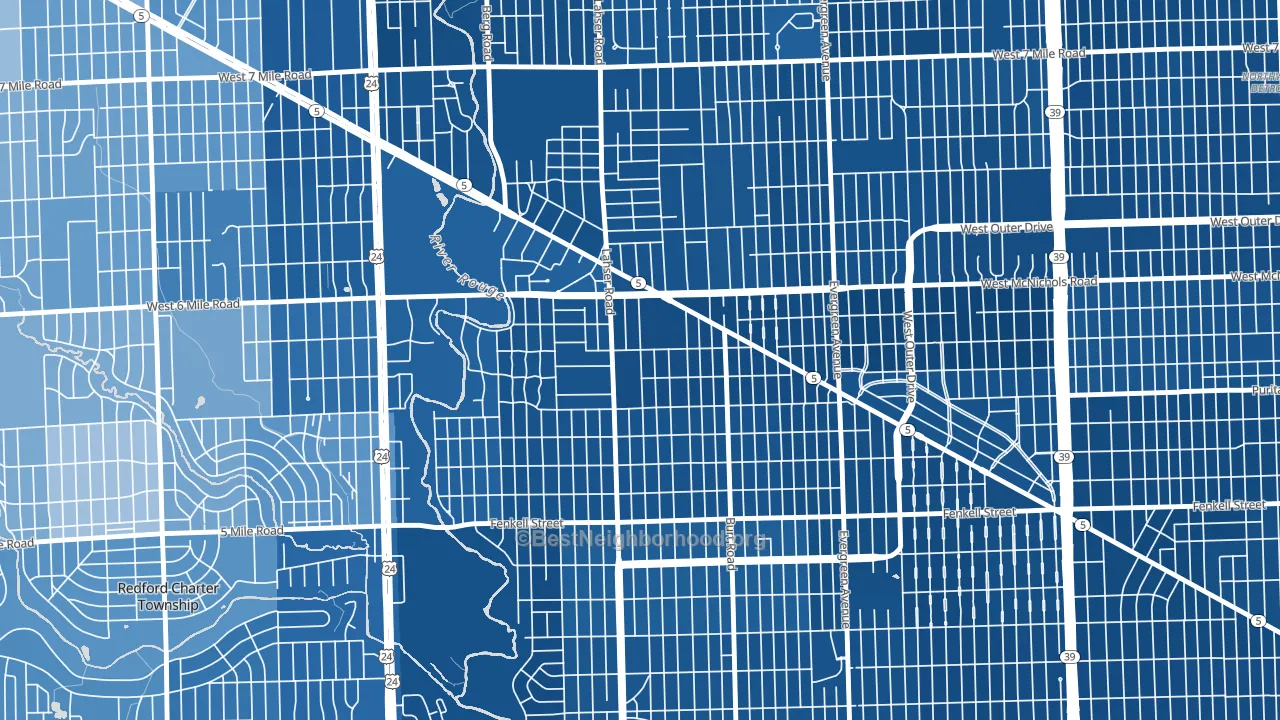
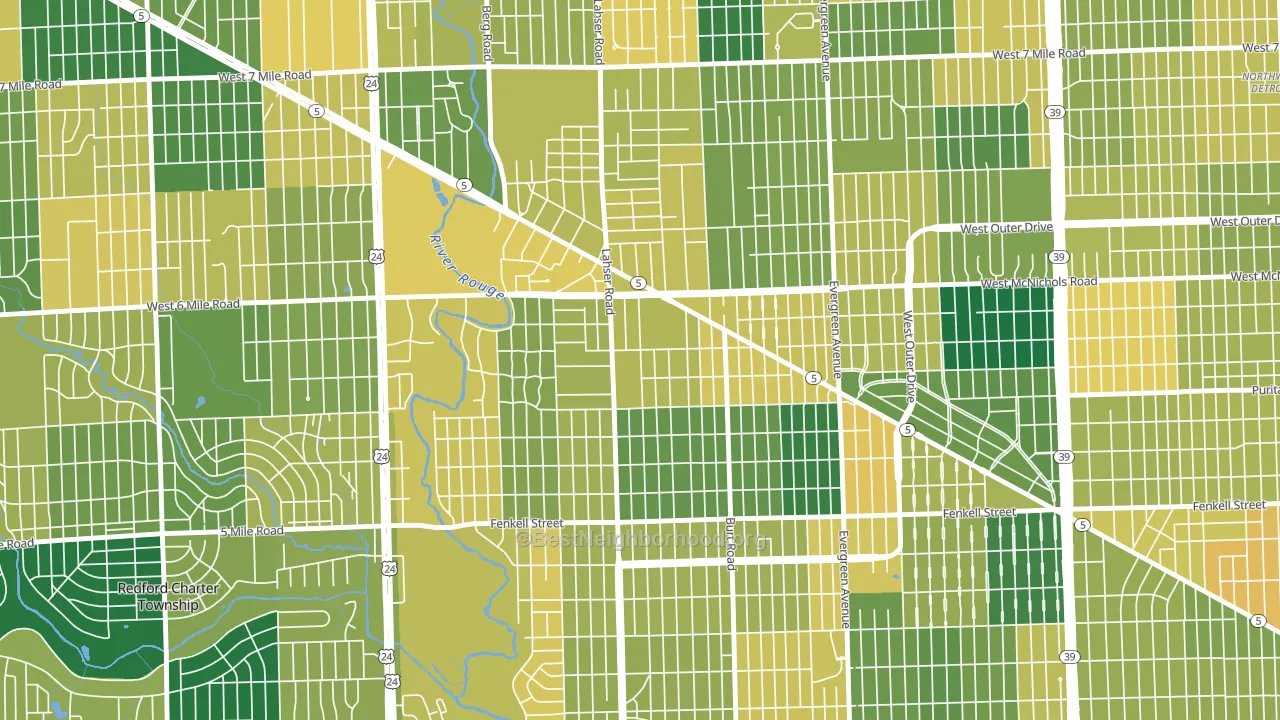
About 69% of adults in Riverdale typically vote, above the U.S. average of about 62%. Among adults in Riverdale, ~64% vote Democratic, ~5% Republican, and ~31% don't vote. The map below shows estimated turnout by block group.
How Riverdale compares
Among neighborhoods within 5 miles, Riverdale leans more Democratic than 8 of 26 neighbors.
Riverdale runs about 86 points more Democratic than Michigan as a whole. Michigan is roughly evenly split, and Riverdale sits clearly on the Democratic side.
Why Riverdale leans the way it does
This analysis examined 14,881 data points per neighborhood to find what predicts political lean and turnout. The items below are a few correlations that stood out for Riverdale, not a ranked or complete list of what matters most.
Riverdale votes against the grain of Michigan. Michigan is roughly evenly split, while Riverdale runs about 86 points more Democratic. A high never-married share predicts Democratic voting, and about 52% of adults in Riverdale have never been married, above 85% of neighborhoods.
Park access and Democratic lean
Places with heavy park coverage tend to lean Democratic; Riverdale, Detroit, MI sits in the top quarter nationally on this measure. Park access does not change how people vote; it tends to track denser, higher-income areas.
Why turnout in Riverdale looks the way it does
Turnout in Riverdale sits close to the national pattern. Learn more about the findings and methodology on the political spectrum map.
Nearby Neighborhoods
- Old Redford, Detroit, MI D+83
- Brightmoor, Detroit, MI D+82
- North Rosedale Park, Detroit, MI D+86
- Evergreen, Detroit, MI D+87
- The Eye, Detroit, MI D+70
- Rosedale Park, Detroit, MI D+88
- Berg-Lasher, Detroit, MI D+88
- O Hair Park, Detroit, MI D+87
- Castle Rouge, Detroit, MI D+82
- Crary-St Marys, Detroit, MI D+87
Neighborhoods with Similar Populations
- Kilbourn Town, Milwaukee, WI D+57
- Curtis Park, Sacramento, CA D+66
- Stonehaven, Charlotte, NC D+18
- Fairmount, Fort Worth, TX D+28
- Western Corridor, Green Bay, WI D+15
- Plum Orchard, New Orleans, LA D+84
- Ardmore, Winston-Salem, NC D+49
- North Stonehurst, Oakland, CA D+59
- Berger, Dolton, IL D+82
- Madison Park, Charlotte, NC D+24
Sources and methodology
Precinct-level voting records used to fit the model come from Michigan Department of State, Elections, distributed by the Voting and Election Science Team. Demographic inputs come from the U.S. Census Bureau (ACS 5-year estimates and the 2020 Decennial Census). Health and environmental inputs come from the CDC (PLACES and the Environmental Justice Index). Land cover comes from the USGS and EPA. Election-day and lead-up weather come from PRISM 4km daily grids and the NOAA Global Historical Climatology Network. Mail-voting and election-administration patterns come from the MIT Election Lab's Survey of the Performance of American Elections. Block-group crime detail comes from CrimeGrade. Internet data and modeling support provided by ISPreports.org.
Modeling and analysis by the BestNeighborhood data science team. Full methodology and findings: political spectrum map.
Methodology reviewed by the BestNeighborhood data team. Last updated May 2026.